
The Pennsylvania humidity profile
Pennsylvania is not a Gulf Coast state, so its mold risk surprises people. The climate is humid continental (Koppen Dfa), which means warm humid summers and cold snowy winters with no dry season at any point in the year. According to NOAA-derived station data and published climatological summaries, every major Pennsylvania metro posts an annual average relative humidity in the mid to high 60s percent, and the northeast of the state runs higher. That is close to the U.S. national average on paper, but two local factors push real indoor risk well above what the headline number suggests.
The first factor is the housing stock. Pennsylvania has one of the oldest housing inventories in the United States, with a large share of homes built before 1970. Many of those homes sit on stone or concrete-block foundations with unconditioned basements and cellars. A below-grade wall stays close to the year-round ground temperature, which in Pennsylvania is roughly the low to mid 50s Fahrenheit. When warm humid summer air at a 60 F to 65 F dew point reaches a 55 F wall or floor, water condenses on the surface. EPA guidance says porous materials kept damp longer than 24 to 48 hours are at risk of mold colonization. A Pennsylvania basement can hold those conditions for months.
The second factor is flood history. Pennsylvania drains two major river systems, the Susquehanna and the Delaware, plus the Ohio and Allegheny in the west. Hurricane Agnes in June 1972 remains the wettest tropical cyclone on record for the state and crested the Susquehanna at Wilkes-Barre more than 20 feet above flood stage, damaging tens of thousands of homes. Tropical Storm Lee in 2011 and the remnants of Hurricane Ida in 2021 both triggered federal disaster declarations for Pennsylvania counties. Each major flood resets the bulk-water clock on porous materials in basements and first floors across the affected river valleys.
Pennsylvania vs U.S. average
| Metric | Pennsylvania | U.S. average | Source |
|---|---|---|---|
| Annual avg relative humidity | 66-70% | ~65% | NOAA-derived station data |
| Annual avg dew point | ~42-48 F | ~50 F | NOAA NWS 1991-2020 |
| Summer (Jun-Aug) avg dew point | ~60-65 F | varies | NOAA NWS 1991-2020 |
| Share of homes built before 1970 | high (among oldest in U.S.) | lower | U.S. Census housing data |
| Wettest tropical cyclone on record | Agnes, 1972 (up to ~19 in) | varies | USGS / NOAA NWS |
Humidity and dew point figures are approximate climatological normals drawn from NOAA National Weather Service station data and published summaries, not live or exact readings. Treat them as typical-year ranges.
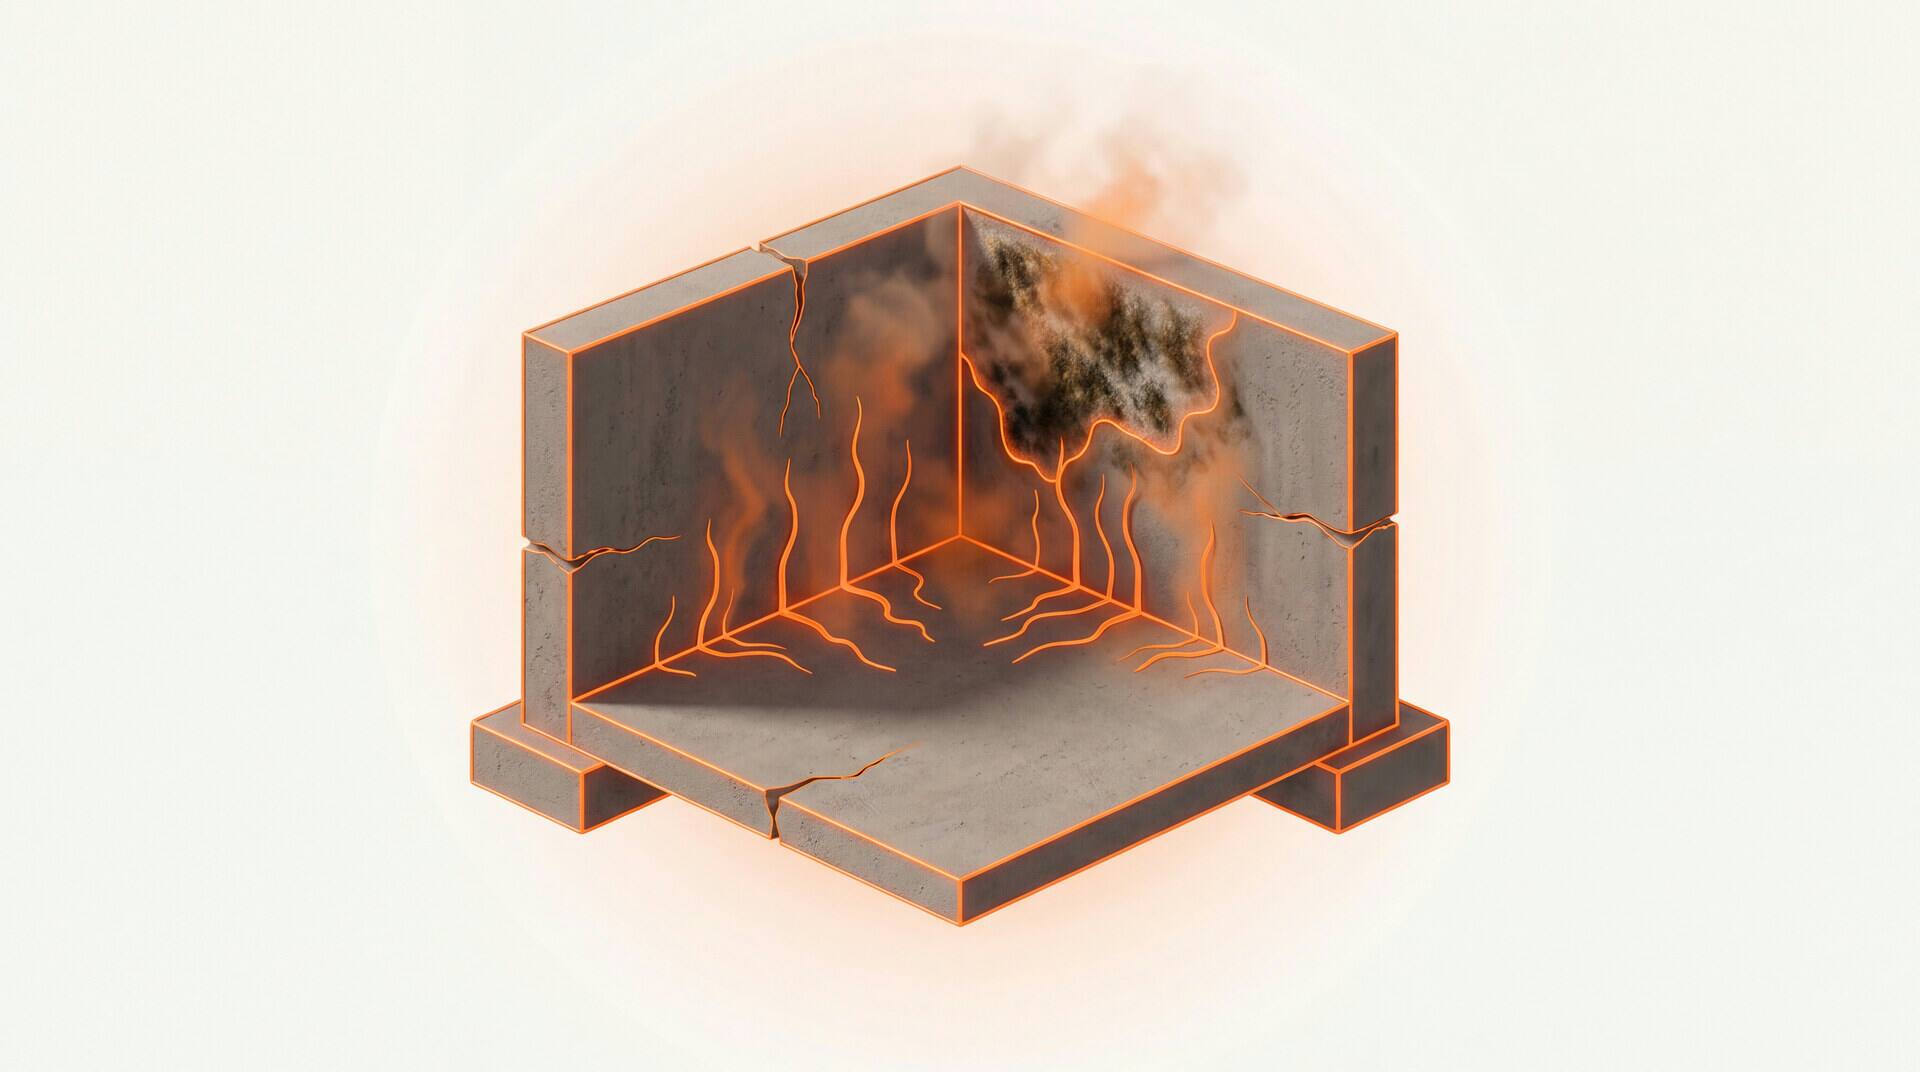
Pennsylvania’s five metros ranked by mold risk
Methodology. Composite risk score = (annual avg RH) × (days/year above 70 percent RH) × (basement-and-flood weight 1.0 to 1.4 based on age of housing stock, share of homes with below-grade basements, and documented river-basin flood exposure). All humidity inputs are approximate climatological normals from NOAA NWS 1991-2020 station data for the official airport station serving each metro. Flood weighting reflects USGS and NOAA NWS flood history for the Susquehanna, Delaware, and Ohio river basins.
Every place on file, ranked by avg RH
Scranton / Wilkes-Barre reads ~70% against ~66% at Harrisburg. The target for a basement is 50 percent, so every row on this chart sits above it.
View the data
| # | Place | Avg RH |
|---|---|---|
| 1 | Scranton / Wilkes-Barre | ~70% |
| 2 | Pittsburgh | ~68% |
| 3 | Allentown (Lehigh Valley) | ~69% |
| 4 | Philadelphia | ~67% |
| 5 | Harrisburg | ~66% |
| # | Metro | Avg RH | Avg dew pt | Risk band | Notes |
|---|---|---|---|---|---|
| 1 | Scranton / Wilkes-Barre | ~70% | ~45 F | Very high | Highest annual RH of the five, winter months near 84 percent. Susquehanna and Lackawanna valley flood history (Agnes 1972, Lee 2011). Old anthracite-era housing stock. |
| 2 | Pittsburgh | ~68% | ~45 F | High | Three-rivers terrain, frequent overcast, hilly lots with poor basement drainage. Dense pre-war wood and brick housing with stone foundations. |
| 3 | Allentown (Lehigh Valley) | ~69% | ~45 F | High | Humid continental valley, September RH near 74 percent. Mix of century-old rowhomes and post-war suburban basements. |
| 4 | Philadelphia | ~67% | ~48 F | High | Warmest of the five with the highest summer dew points. Vast stock of attached brick rowhomes with shared damp party walls and stone-foundation cellars. |
| 5 | Harrisburg | ~66% | ~46 F | Moderate to high | Lowest annual RH of the five but sits on the lower Susquehanna with direct flood exposure. February RH near 80 percent. |
Scranton / Wilkes-Barre
Highest annual RH of the five, winter months near 84 percent. Susquehanna and Lackawanna valley flood history (Agnes 1972, Lee 2011). Old anthracite-era housing stock.
Pittsburgh
Three-rivers terrain, frequent overcast, hilly lots with poor basement drainage. Dense pre-war wood and brick housing with stone foundations.
Allentown (Lehigh Valley)
Humid continental valley, September RH near 74 percent. Mix of century-old rowhomes and post-war suburban basements.
Philadelphia
Warmest of the five with the highest summer dew points. Vast stock of attached brick rowhomes with shared damp party walls and stone-foundation cellars.
Harrisburg
Lowest annual RH of the five but sits on the lower Susquehanna with direct flood exposure. February RH near 80 percent.
Why Scranton and Wilkes-Barre top the ranking. Three factors compound in northeast Pennsylvania. First, humidity: the Avoca reporting station that serves the Scranton and Wilkes-Barre metro posts the highest annual average RH of the five metros, with winter months near 84 percent. Second, flood history: the Wyoming Valley sits in the Susquehanna and Lackawanna floodplains, and Hurricane Agnes crested the river here more than 20 feet above flood stage in 1972, an event the region still references when assessing basement risk. Third, housing stock: the anthracite coal era left a dense inventory of late-1800s and early-1900s homes with stone foundations and chronically damp cellars that hold condensation through the humid months.
Why Harrisburg ranks lowest but is still a real risk. Harrisburg posts the lowest annual average RH of the five metros, which pulls its score down. The trade-off is geography: the city sits directly on the lower Susquehanna, the same river that delivered the Agnes and Lee floods upstream, so flood exposure is direct rather than theoretical. Combine that with February humidity near 80 percent and the same old-housing basement pattern as the rest of the state, and Harrisburg still clears the threshold for ongoing attention.
Common mold species in Pennsylvania homes
Every EPA indoor air quality guide lists the same core species for cool, damp, basement-driven climates. Pennsylvania homes concentrate five of them, with the basement leading the way.
Penicillium and Aspergillus group
Penicillium spp. / Aspergillus spp.The single most frequently recovered group in damp Pennsylvania basements. Blue-green to gray-green. This group can grow on cool surfaces with humidity alone as the moisture source, no liquid water needed, which is exactly the basement condensation pattern. EPA and CDC list these as common allergenic genera, and certain Aspergillus species can cause aspergillosis in immunocompromised individuals.
Cladosporium
Cladosporium spp.Olive-green to black. The most common indoor mold nationwide. It tolerates cold surfaces, so in Pennsylvania it colonizes basement walls, cold-water pipes, window sills with winter condensation, and HVAC components. EPA lists it as a common allergenic mold found wherever surfaces stay damp.
Stachybotrys chartarum
Stachybotrys chartarumThe species commonly called “toxic black mold.” Requires sustained wet cellulose (wet drywall, wet ceiling tile, wet paper-faced insulation). In Pennsylvania it shows up most after basement flooding, a burst pipe, or a chronic foundation leak that keeps materials saturated for days. When to worry: visible black slimy growth on water-stained drywall after a flood or leak. Do not disturb. Contain and remediate.
Alternaria
Alternaria alternataDark green to black. Thrives in windows, shower stalls, and around any condensation-prone surface, including the cool window wells common in Pennsylvania basements. Commonly flagged on allergenic panels and often correlated with asthma exacerbation in sensitive individuals. EPA identifies Alternaria as one of the dominant indoor genera in damp homes.
Chaetomium
Chaetomium spp.Cotton-like, turning gray to brown to black with age, often with a musty odor. A marker of chronic water damage on drywall and wood, which is why it appears in older Pennsylvania homes with long-standing foundation moisture or past flood damage that was never fully dried. Listed among the molds associated with persistently wet indoor materials.
Species information is general and informational. Health responses vary. Consult a physician for symptom evaluation. Species sources: EPA Mold Remediation in Schools and Commercial Buildings, EPA A Brief Guide to Mold Moisture and Your Home, CDC National Center for Environmental Health guidance.
Pennsylvania-specific actions
Three actions account for most of the mold risk reduction available to a Pennsylvania homeowner. Each maps to an existing free Mold Scanner AI tool.
A. Control the basement first
The basement is where most Pennsylvania mold starts. Run a basement-rated dehumidifier from late spring through early fall and keep it draining to a sump or floor drain so you do not have to empty a tank. Grade soil away from the foundation, extend downspouts at least four feet from the wall, and clear any French drain or interior perimeter drain that has silted up. Never vent a clothes dryer indoors. After any heavy rain, check the basement within 48 hours: EPA guidance says porous materials wet longer than 24 to 48 hours are at risk of colonization. Materials that still read above 16 percent moisture content after 72 hours of drying should be removed.
B. Keep indoor RH below 50 percent in the humid months
Use a hygrometer in the basement and on the main living level. Add portable dehumidification in any room above 55 percent. EPA guidance: 30 to 50 percent indoor relative humidity. For Pennsylvania, target 40 to 50 percent in summer, and watch the basement most closely because it runs wettest.
C. Scan quarterly, especially in spring and after storms
Pennsylvania’s four highest-risk windows are May (spring rain plus snowmelt runoff), August (peak humidity and dew point), September (tail of tropical-remnant rain), and the spring thaw when frozen ground releases moisture into foundations.
Seasonal risk profile for Pennsylvania
Monthly average RH across the five reporting stations, expressed as percent of the year the indoor growth threshold is most often approached. Based on approximate NOAA NWS climatological normals 1991-2020 and published station summaries.
Pennsylvania relative humidity peaks in September
The monthly mean runs from 62 percent in April to 74 percent in September, a 12 point swing across the year.
View the data
| Month | Jan | Feb | Mar | Apr | May | Jun | Jul | Aug | Sep | Oct | Nov | Dec |
|---|---|---|---|---|---|---|---|---|---|---|---|---|
| Mean RH | 72% | 70% | 66% | 62% | 68% | 70% | 70% | 72% | 74% | 73% | 72% | 73% |
Relative humidity stays elevated every month in Pennsylvania, but the real growth driver is the gap between humid air and cool basement surfaces. Summer dew points in the 60s F over 55 F basement walls produce condensation even when the upstairs feels comfortable. There is no true dry season for a basement here.
Where to get help in Pennsylvania
Pennsylvania has no state-level mold disclosure or remediation licensing statute, and the Department of Environmental Protection does not regulate residential mold. The agencies below are the authoritative starting points.
Questions on file
Is mold a problem in Pennsylvania even though it is not a Gulf Coast state?
Yes. Pennsylvania sits in a humid continental climate (Koppen Dfa) with no dry season. Annual average relative humidity across Pennsylvania metros runs roughly 66 to 70 percent based on NOAA-derived station data, and winter months in the northeast of the state climb past 80 percent. The bigger driver is the housing stock: Pennsylvania has one of the oldest housing inventories in the country, with millions of homes built before 1970 that have stone or block foundations and damp, often unconditioned basements. Cool below-grade surfaces plus humid summer air produce condensation, which is the most common starting point for indoor mold here.
Source 7, , National Oceanic and Atmospheric AdministrationWhy do Pennsylvania basements grow mold so easily?
A below-grade basement wall stays close to the year-round ground temperature, roughly the low to mid 50s Fahrenheit in Pennsylvania. When warm humid summer air at a 65 F dew point touches a 55 F wall or floor, water condenses on the surface. EPA guidance says porous materials kept damp longer than 24 to 48 hours are at risk of mold colonization. Add a stone or block foundation that wicks groundwater, a French drain that has silted up, or a dryer venting indoors, and a Pennsylvania basement can hold the conditions for growth for months at a time.
What Pennsylvania mold species should I watch for?
In damp Pennsylvania basements the Penicillium and Aspergillus group is the most frequently recovered, followed by Cladosporium on cool surfaces and, where cellulose has stayed wet, Stachybotrys chartarum (black mold). Alternaria and Chaetomium also appear in older homes with chronic moisture. EPA notes all molds can cause reactions in sensitive people. See a physician for symptom evaluation. This page is general information, not medical advice.
Do Pennsylvania homes need a dehumidifier?
In most Pennsylvania basements, yes, at least from late spring through early fall. EPA recommends keeping indoor relative humidity below 50 percent to suppress mold growth. Pennsylvania summer dew points routinely sit in the 60s Fahrenheit, which keeps basement air above the 50 percent target unless a dehumidifier runs. A basement-rated dehumidifier with a condensate pump that drains to a sump or floor drain is standard guidance for the region. Upstairs living areas usually stay below 50 percent in summer because of air conditioning, but unconditioned attics and three-season rooms still need attention.
What does Pennsylvania law say about mold in a rental?
General information only. Pennsylvania has no statute that specifically addresses a landlord’s duties for mold prevention or remediation. Pennsylvania tenants are protected by the implied warranty of habitability, established by the Pennsylvania Supreme Court in Pugh v. Holmes, 405 A.2d 897 (Pa. 1979), which requires rentals to be safe, sanitary, and fit to live in. Mold severe enough to make a unit uninhabitable can be a breach of that warranty. The Pennsylvania Department of Environmental Protection does not regulate residential mold, so complaints generally go to local or county code enforcement. Consult a licensed Pennsylvania attorney for your situation. Tenant-rights information is available through PALawHelp.org.
What is the best humidity level for a Pennsylvania home?
EPA guidance is 30 to 50 percent indoor relative humidity. For Pennsylvania, aim for 40 to 50 percent in summer and watch basements most closely because they run wettest. In winter, drier indoor air can drop below 30 percent on the upper floors, which is fine for mold but uncomfortable. Use a hygrometer in the basement and on the main living level, and add dehumidification anywhere a room holds above 55 percent for more than a few hours.
How much does mold remediation cost in Pennsylvania?
Most Pennsylvania remediation jobs run roughly 1,200 to 3,800 USD for contained areas, with a statewide average near 2,400 USD according to home-services cost data. A typical basement job runs 500 to 3,000 USD. Large or whole-home contamination after a flood, when drywall, insulation, subfloor, and finished basement materials all need replacement, can reach 10,000 to 30,000 USD or more. Always use contractors who follow the IICRC S520 standard (ACAC or RIA credentials also qualify). See our remediation cost guide for a detailed breakdown.
Source 3, , Institute of Inspection, Cleaning and Restoration CertificationIs there help after a Pennsylvania flood?
FEMA Individual Assistance can cover some post-disaster cleanup and temporary housing when the President declares a federal disaster, as happened after Tropical Storm Lee in 2011 and Hurricane Ida in 2021. The Pennsylvania Emergency Management Agency (PEMA) coordinates state-level recovery. Standard homeowners and renters policies usually exclude flood damage, which requires a separate NFIP flood policy with a 30-day waiting period. Check disasterassistance.gov and pema.pa.gov after any declared event. Eligibility depends on the specific disaster declaration.
Source register
Every source chip on this page points here. Agency and statute pages first, then the federal technical references.
Find the mold in your Pennsylvania home
The scanner is open. Get a detailed photo report, next steps, testing options and estimated cleanup costs.
Scan My Photo Get the free mold checklistRelated guides on Mold Scanner AI

Mold Risk by ZIP Code
Type your ZIP, get climate based mold risk.
Water Damage Documentation Helper
Record accessible water-event conditions without a risk score.
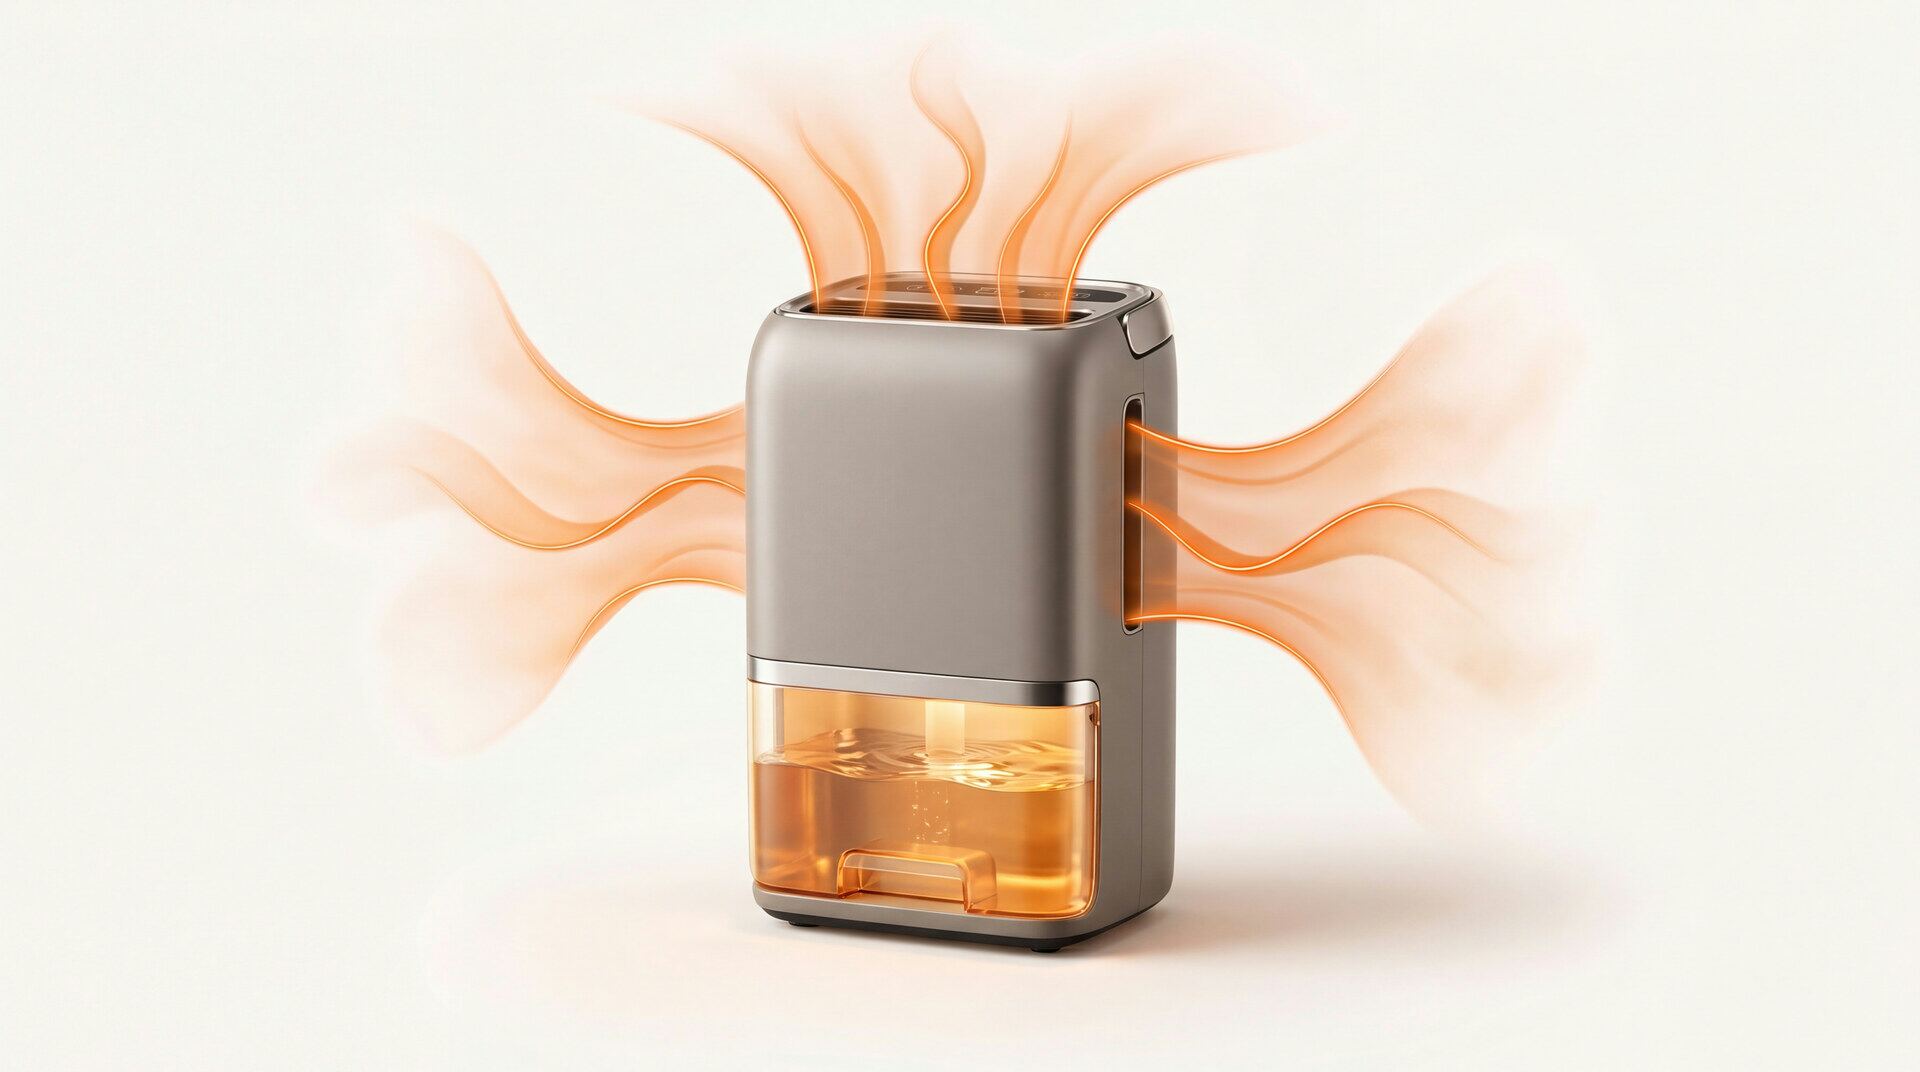
Picking the Right Dehumidifier
Sizing, drain options, and the spec that matters.
Mold Growth Timeline
Hour by hour: when spores germinate and colonies appear.
Indoor Humidity from Your Phone
What works, what does not, and a free alternative.

Stop Mold in a Closed Up House
Vacation home, rental, second property.