
The Texas humidity profile
Texas is the only state where one border town lives in a swamp climate and another lives in a desert. Houston posts an annual average relative humidity near 75 percent by NOAA National Weather Service climatological normals for 1991 to 2020. El Paso, more than 700 miles west, sits near 40 percent. The line between them is the defining feature of Texas mold risk: east of Interstate 35, conditions look like Louisiana. West of the Pecos, mold needs a plumbing failure to survive.
Dew point tells the eastern story more honestly than RH. Gulf Coast metros run annual average dew points in the low 60s F against a national average near 50 F, and from late May through September coastal dew points sit at or above 70 F. At that load, any surface an air conditioner cools below the dew point sweats. Supply registers, closet walls on exterior corners, and uninsulated ductwork all become condensation farms in a Houston or Corpus Christi August.
Then come the storms. Texas trails only Florida for hurricane landfalls since 1851 in the NOAA National Hurricane Center record. Hurricane Harvey stalled over the upper coast in 2017, dropped more than 60 inches of rain near Nederland (a U.S. tropical cyclone record), and flooded more than 100,000 homes in Harris County alone. Inland, the Interstate 35 corridor from San Antonio through Austin is nicknamed flash flood alley, and the February 2021 winter storm burst pipes in homes across the state. Every one of those events starts the same clock: EPA guidance says wet porous materials are at risk of mold colonization within 24 to 48 hours.
The Texas gradient vs the U.S. average
| Metric | Gulf Coast Texas | West Texas (El Paso) | U.S. average | Source |
|---|---|---|---|---|
| Annual avg relative humidity | 74-76% | ~40% | ~65% | NOAA NWS 1991-2020 |
| Annual avg dew point | 61-64 F | mid 30s F | ~50 F | NOAA NWS 1991-2020 |
| Days/year above 70% RH | 180-230 | fewer than 40 | ~120 | NOAA NWS 1991-2020 |
| Hurricane landfalls since 1851 | 2nd most of any state | none | varies | NOAA NHC |
Humidity values are approximate, from NOAA 1991-2020 normals, rounded to whole percent.
Texas’s six metros ranked by mold risk
Methodology. Composite risk score = (annual avg RH) × (days/year above 70 percent RH) × (storm-exposure weight 1.0 to 1.5 based on NOAA NHC landfall density and major flood history within 50 miles of the metro centroid). Humidity inputs are approximate, from NOAA 1991-2020 normals for the official airport station serving each metro, rounded to whole percent. The ranking is editorial: it blends climate exposure with housing stock age and construction type.
Every place on file, ranked by avg RH
Beaumont-Port Arthur reads 76% against 65% at Dallas-Fort Worth. The target for a basement is 50 percent, so every row on this chart sits above it.
View the data
| # | Place | Avg RH |
|---|---|---|
| 1 | Houston | 75% |
| 2 | Beaumont-Port Arthur | 76% |
| 3 | Corpus Christi | 76% |
| 4 | San Antonio | 66% |
| 5 | Austin | 66% |
| 6 | Dallas-Fort Worth | 65% |
| # | Metro | Avg RH | Avg dew pt | Risk band | Notes |
|---|---|---|---|---|---|
| 1 | Houston | 75% | 62 F | Extreme | Bayou flood plain on clay soil. Harvey flooded more than 100,000 Harris County homes in 2017. |
| 2 | Beaumont-Port Arthur | 76% | 63 F | Extreme | Harvey’s heaviest rain fell here. Tropical Storm Imelda flooded many of the same homes again in 2019. |
| 3 | Corpus Christi | 76% | 64 F | Very high | Steadiest coastal humidity in the state. Harvey came ashore as a Category 4 just up the coast at Rockport. |
| 4 | San Antonio | 66% | 57 F | High | Flash flood alley along the Balcones Escarpment. Gulf air pools against the hills on summer nights. |
| 5 | Austin | 66% | 56 F | High | Same flash-flood corridor as San Antonio plus a fast-growing slab-on-grade housing stock. |
| 6 | Dallas-Fort Worth | 65% | 53 F | Moderate | Near the national humidity average, but hail-season roof leaks and shifting clay foundations open water paths. |
Houston
Bayou flood plain on clay soil. Harvey flooded more than 100,000 Harris County homes in 2017.
Beaumont-Port Arthur
Harvey’s heaviest rain fell here. Tropical Storm Imelda flooded many of the same homes again in 2019.
Corpus Christi
Steadiest coastal humidity in the state. Harvey came ashore as a Category 4 just up the coast at Rockport.
San Antonio
Flash flood alley along the Balcones Escarpment. Gulf air pools against the hills on summer nights.
Austin
Same flash-flood corridor as San Antonio plus a fast-growing slab-on-grade housing stock.
Dallas-Fort Worth
Near the national humidity average, but hail-season roof leaks and shifting clay foundations open water paths.
Why Houston tops the ranking. Three factors compound. First, humidity: the Houston airports report annual averages within a point or two of New Orleans. Second, geography: the metro drains through slow bayous across flat clay that barely absorbs water, which is why one stalled storm can put whole neighborhoods under water for days. Third, scale: millions of housing units sit in that flood plain, from slab-on-grade ranches to older pier-and-beam blocks where a damp crawl space feeds the floor above it.
Why Dallas-Fort Worth still makes the list. DFW humidity is close to the national average, so the risk shifts from climate to plumbing and weather damage. Spring supercells drop hail that opens roofs. Expansive clay soil moves foundations enough to crack supply lines inside slabs. The 2021 freeze showed how fast burst pipes turn a dry metro wet. The mold that follows hides in wall cavities rather than on window sills, which is why mold behind walls is the DFW pattern to learn.
Common mold species in Texas homes
EPA indoor air quality guidance lists the same core genera for warm humid climates. Texas homes east of Interstate 35 concentrate five of them.
Cladosporium
Cladosporium spp.The most common indoor mold nationwide and the usual find on Texas HVAC evaporator coils and supply register halos. Olive-green to black. Air conditioning runs eight or more months a year in most of the state, so condensate lines and duct interiors stay damp. EPA lists it as a common allergenic mold.
Aspergillus
Aspergillus spp.Black, green, or dark brown depending on species. Prefers surfaces with steady moisture and organic dust, which is why it dominates bathroom grout, caulking, and washing-machine gaskets along the Gulf Coast. EPA and CDC flag Aspergillus species as allergens and, in rare cases, as a cause of aspergillosis in immunocompromised individuals.
Stachybotrys chartarum
Stachybotrys chartarumThe species commonly called toxic black mold. Requires sustained wet cellulose: wet drywall, wet ceiling tile, wet paper-faced insulation. In Texas it shows up most often 72+ hours after hurricane flooding, slab leaks, or burst pipes. Visible black slimy growth on water-stained drywall is the signature. Do not disturb it. Contain and remediate.
Penicillium
Penicillium spp.Blue-green. Grows on carpet padding, wallpaper, and damp fabric. Texas shoulder seasons, when the AC barely runs but Gulf moisture keeps coming, give it weeks of indoor humidity above 60 percent to work with. EPA lists Penicillium among the most frequently recovered genera in indoor air samples.
Alternaria
Alternaria alternataDark green to black. Thrives on window tracks, shower stalls, and any condensation-prone surface. Commonly flagged on allergen panels and often correlated with asthma flare-ups in sensitive individuals per EPA remediation guidance.
Species information is general and informational. Health responses vary. See a licensed physician for symptom evaluation. If you suspect hidden growth after a flood or leak, an ERMI dust test can profile the spores that settled in your home. Species sources: EPA Mold Remediation in Schools and Commercial Buildings, EPA A Brief Guide to Mold Moisture and Your Home, CDC National Center for Environmental Health guidance.
Texas-specific actions
Three moves cover most of the controllable risk, and one piece of state paperwork protects your resale value.
A. Run the storm checklist every season
Coastal metros, by June 1: roof inspection, gutters cleared, HVAC serviced, flood policy verified (NFIP has a 30-day waiting period). First 48 hours after any flood, surge, or burst pipe: remove standing water, open windows only when outdoor humidity is lower than indoor, run any working AC or dehumidifier, and photograph everything for insurance. First 7 days: cut out wet drywall a foot above the water line, pull saturated insulation and carpet pad, dry framing with air movers, and log moisture readings daily.
B. Hold indoor humidity below 50 percent
EPA generally advises keeping indoor relative humidity between 30 and 50 percent when possible. Use a reliable hygrometer and repeat readings in different locations and at different times. The Indoor Humidity Context Calculator reports measured RH plus calculated dew point and absolute humidity; it does not predict mold growth or prescribe equipment settings. Use our guide on how to prevent mold for general moisture-control context.
C. Know the licensing line before you hire or DIY
Texas regulates this work. Under the Texas Mold Assessment and Remediation Rules (TMARR), a job where contamination covers 25 contiguous square feet or more requires a TDLR-licensed assessor and remediator, and the state separates the two roles on the same project. For small spots under the threshold, our how to get rid of mold guide covers safe cleanup. For anything bigger, hire a qualified mold remediation professional (one who follows the IICRC S520 standard; ACAC or RIA credentials and state licenses count too) and confirm the Texas license on TDLR's site. When licensed work finishes and passes assessment, you get the Certificate of Mold Damage Remediation. Keep it: it documents the fix for insurers and transfers to a buyer if you sell within five years.
Seasonal risk profile for Texas
Monthly average relative humidity across the state, based on NOAA NWS climatological normals for 1991-2020. Values are approximate statewide averages, rounded to whole percent.
Texas relative humidity peaks in May
The monthly mean runs from 60 percent in August to 68 percent in May, a 8 point swing across the year.
View the data
| Month | Jan | Feb | Mar | Apr | May | Jun | Jul | Aug | Sep | Oct | Nov | Dec |
|---|---|---|---|---|---|---|---|---|---|---|---|---|
| Mean RH | 67% | 66% | 64% | 65% | 68% | 66% | 61% | 60% | 64% | 65% | 66% | 67% |
The statewide average hides the gradient. Houston runs roughly ten points above every bar on this chart, and El Paso runs roughly 25 below. The midsummer dip reflects hot dry afternoons inland, not safety: coastal dew points peak in July and August, and May and September bring the state's heaviest rain. Type your ZIP into the mold risk by ZIP tool for your local read.
Where to get help in Texas
Texas runs one of the strictest state mold programs in the country. These are the authoritative starting points.
Questions on file
Does Texas require licensed mold remediation?
Yes, above a small-job threshold. The Texas Mold Assessment and Remediation Rules (TMARR) require a licensed mold assessor and a licensed mold remediator on any project where the contamination covers 25 contiguous square feet or more. The Texas Department of Licensing and Regulation (TDLR) runs the program and lets you verify any license online. Texas also separates the roles: the company that assesses the mold can't be the company that removes it on the same project. Homeowners working on their own homestead are exempt, but skipping the licensed route means no Certificate of Mold Damage Remediation at the end.
Source 1, Texas Department of Licensing and RegulationWhat is the Texas Certificate of Mold Damage Remediation?
It's the document most people call the Texas mold certificate. When a licensed remediator finishes a project and a licensed assessor confirms the cleanup passed, the remediator issues a Certificate of Mold Damage Remediation to the property owner. It matters twice. Texas insurers generally can't treat the home as a higher risk based on mold damage that was properly remediated with a certificate, and if you sell the home within five years, you give the buyer a copy as proof the problem was fixed correctly. Keep it with your closing documents.
Do Texas landlords have to fix mold?
Texas has no mold-specific rental statute, so it runs through general habitability law. The Texas Property Code requires landlords to repair conditions that materially affect the physical health or safety of an ordinary tenant, and serious mold from a leak the landlord won't fix can qualify. The duty triggers after proper written notice while you're current on rent. Document everything in writing, photograph the growth and the leak, and read our guide to mold and apartment rights. General information, not legal advice. For your specific situation, talk to a Texas attorney or your local tenant council.
Is mold risk the same across Texas?
No. Texas spans more than 700 miles east to west and the climate changes completely along the way. Houston averages about 75 percent annual relative humidity, Dallas-Fort Worth sits near 65, and El Paso runs near 40. A Gulf Coast home faces Louisiana-grade conditions while a desert home rarely sees sustained indoor moisture without a plumbing failure. Check your own area with a ZIP code risk lookup, then verify indoors with a hygrometer.
Do Texas homes need a dehumidifier year-round?
East of the Interstate 35 corridor, usually yes. Gulf Coast metros keep outdoor dew points near or above 70 F from late May through September, so shoulder seasons with light AC use let indoor humidity creep past the EPA's 50 percent guideline. In Houston, Beaumont, or Corpus Christi a dedicated dehumidifier is standard advice. In drier metros like Dallas-Fort Worth, a unit earns its keep in bathrooms, utility rooms, and long wet springs. West Texas rarely needs one outside a plumbing failure.
Source register
Every source chip on this page points here. Agency and statute pages first, then the federal technical references.
Find the mold in your Texas home
The scanner is open. Get a detailed photo report, next steps, testing options and estimated cleanup costs.
Scan My Photo Get the free mold checklistRelated guides on Mold Scanner AI
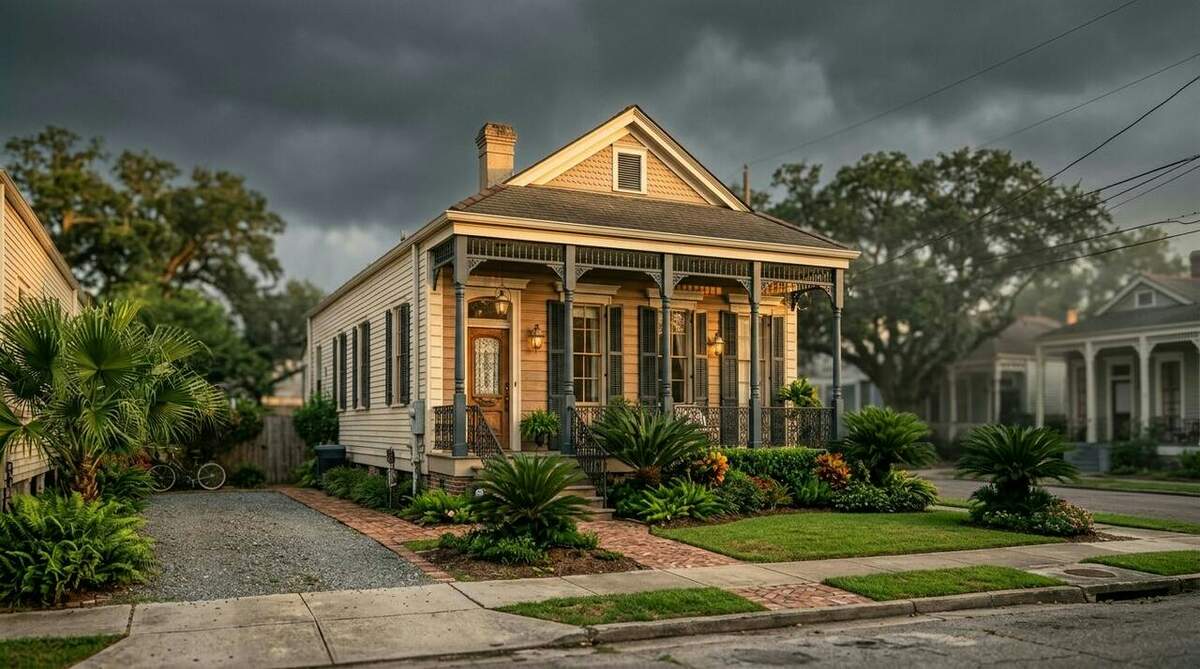
Mold in Louisiana
The neighboring state report: rankings and hurricane rules.
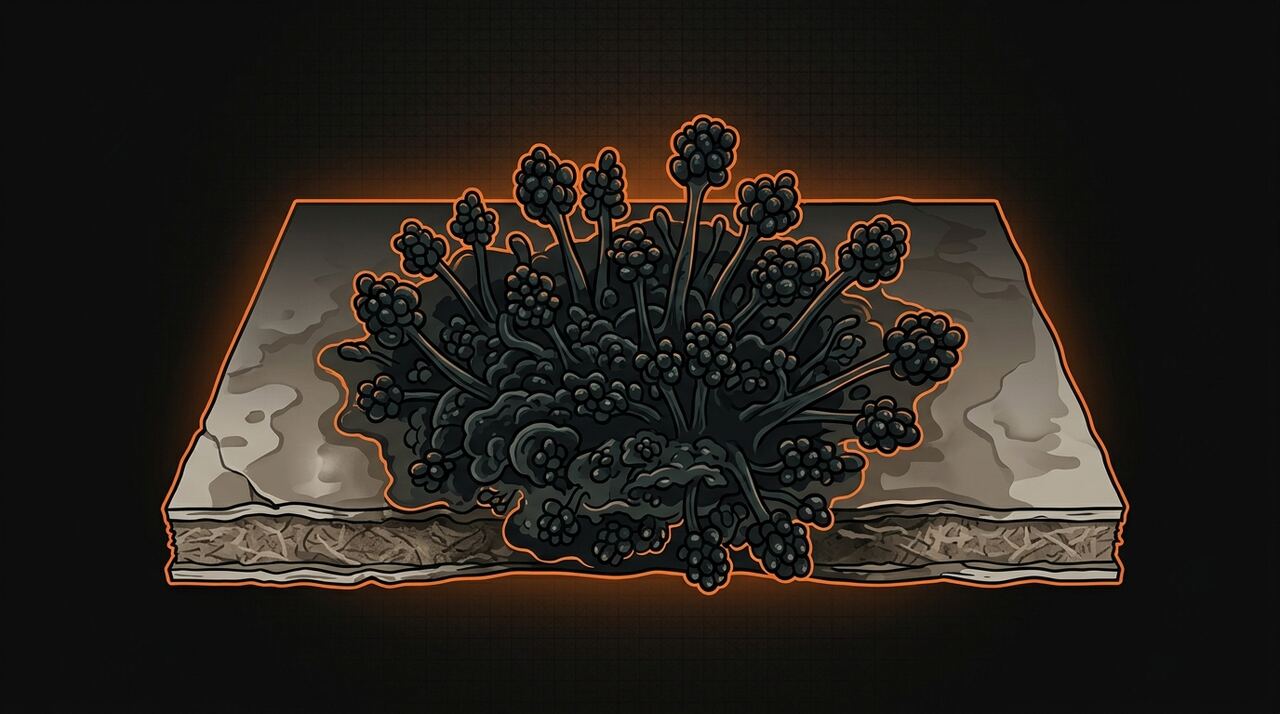
Black Mold Guide
What Stachybotrys is, where it grows, what to do.
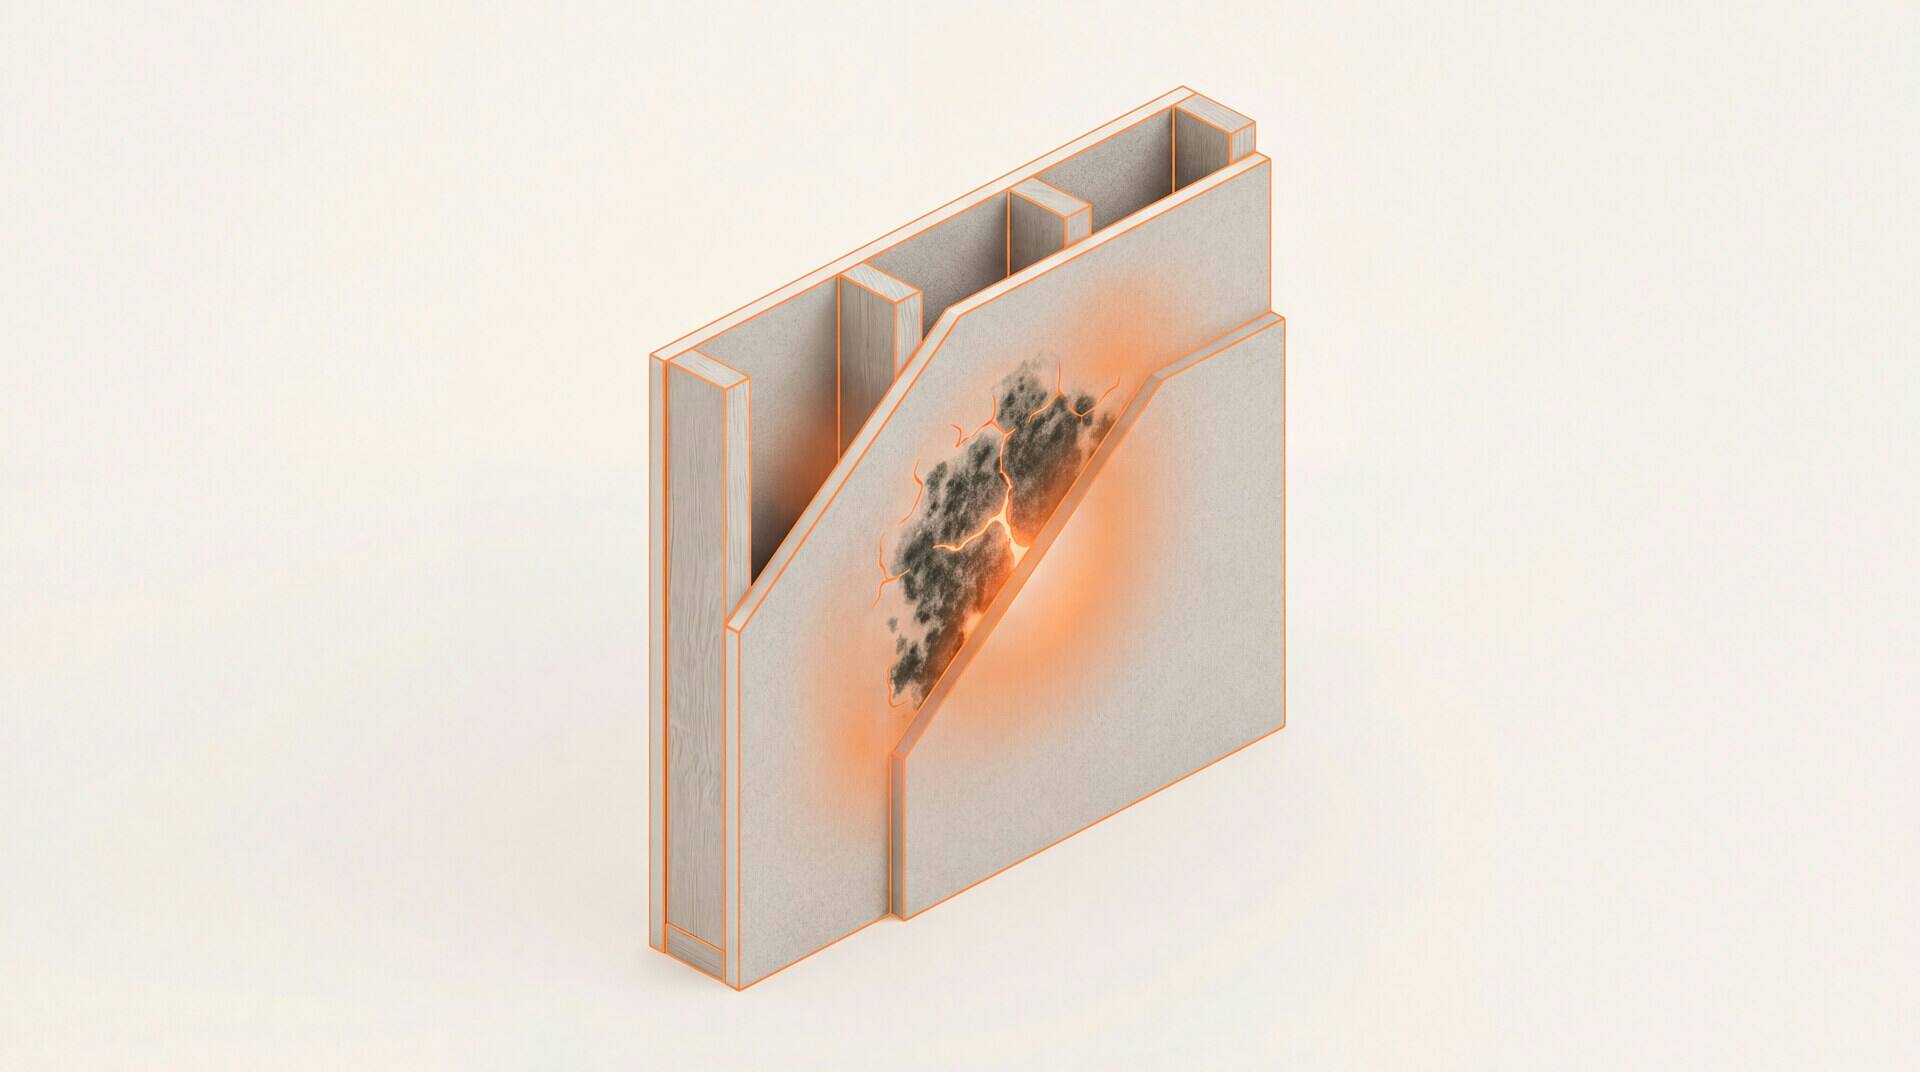
Mold Behind Walls
Signs of hidden growth and how pros confirm it.
Picking the Right Dehumidifier
Sizing, drain options, and the spec that matters.
Mold Growth Timeline
Hour by hour: when spores germinate and colonies appear.

Mold in Your Apartment
Renter rights, notice letters, and landlord duties.