
The North Carolina humidity profile
North Carolina runs about 500 miles from the Outer Banks to the Blue Ridge, and the moisture story changes three times along the way. The coastal plain lives with maritime air off the Atlantic, the piedmont cities sweat through long humid summers, and the mountains trade some humidity for heavy rain and fog. Per NOAA climatological normals for 1991 to 2020, annual average relative humidity across the major metros runs from the mid 60s in Charlotte to the low 70s on the coast, far above the 50 percent indoor ceiling EPA flags as the upper safe bound.
Dew point tells the sharper story. Wilmington’s annual average dew point sits near 58 F against a national average near 50 F, and coastal dew points camp in the low 70s from June through September. Air that wet condenses on any surface the AC cools below it: duct boots, supply registers, floor framing over a crawl space. The mountains run a different pattern. Asheville sits in the French Broad River valley where morning fog is routine, and parts of the Blue Ridge catch more than 80 inches of rain a year.
Then come the storms. North Carolina has taken more than 50 tropical storm or hurricane landfalls since 1851, and per the NOAA National Hurricane Center record, only Florida, Texas, and Louisiana have taken more. Hurricane Florence (2018) is the modern benchmark: ashore near Wrightsville Beach, it stalled and dropped nearly 36 inches of rain at Elizabethtown, a state record. Wilmington was cut off by floodwater for days, and storm surge on the Neuse River pushed into hundreds of New Bern homes. EPA guidance says porous materials wet longer than 24 to 48 hours are at risk of mold colonization.
One construction detail sets North Carolina apart: the crawl space. Roughly half the state’s housing stock sits over one, and most older crawl spaces are vented to the outside. In summer, those vents pull in air with dew points near 70 F that condenses on framing and ductwork chilled by the AC above. Joists stay damp for months, and mold follows. Our crawl space mold guide covers the full inspection.
North Carolina vs U.S. average
| Metric | North Carolina | U.S. average | Source |
|---|---|---|---|
| Annual avg relative humidity | 66-74% (metro range) | ~65% | NOAA NWS 1991-2020 |
| Annual avg dew point | 47-58 F (mountains to coast) | ~50 F | NOAA NWS 1991-2020 |
| Hurricane landfalls since 1851 | 50+ (4th most among states) | varies | NOAA NHC |
| Major flood storms since 1996 | Fran, Floyd, Matthew, Florence, Helene | varies | NOAA / FEMA |
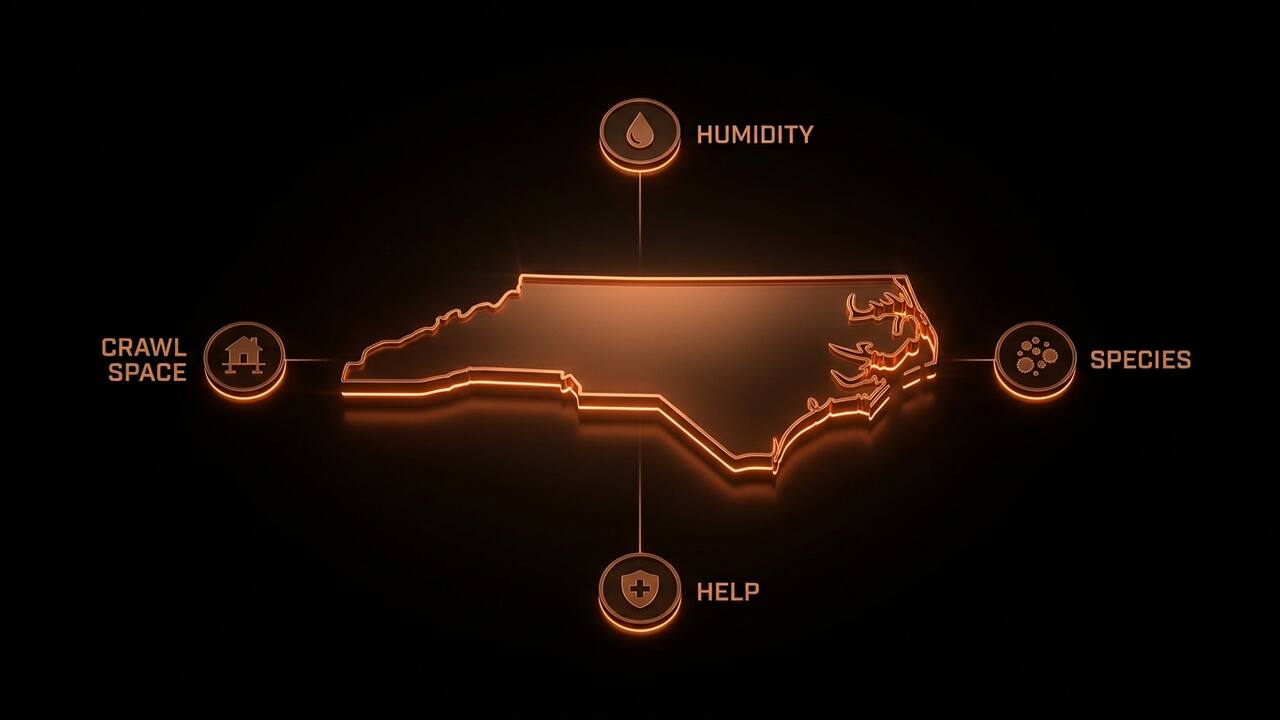
North Carolina’s five metros ranked by mold risk
Methodology. Composite risk score = (annual avg RH) × (days/year above 70 percent RH) × (storm and flood exposure weight 1.0 to 1.5 based on NOAA NHC track density within 50 miles of the metro centroid plus major river-flood history). Humidity values are approximate, from NOAA 1991-2020 normals for the airport station serving each metro, rounded to whole percents. Storm weighting from NOAA NHC track data and FEMA disaster declarations. The ranking is editorial.
Every place on file, ranked by avg RH
Wilmington reads 73% against 66% at Charlotte. The target for a basement is 50 percent, so every row on this chart sits above it.
View the data
| # | Place | Avg RH |
|---|---|---|
| 1 | Wilmington | 73% |
| 2 | Jacksonville / New Bern | 73% |
| 3 | Asheville | 71% |
| 4 | Raleigh-Durham | 68% |
| 5 | Charlotte | 66% |
| # | Metro | Avg RH | Avg dew pt | Risk band | Notes |
|---|---|---|---|---|---|
| 1 | Wilmington | 73% | 58 F | Very high | Florence made landfall nearby in 2018 and stalled. Surge plus record rain over older coastal housing. |
| 2 | Jacksonville / New Bern | 73% | 57 F | Very high | Neuse River surge flooded hundreds of New Bern homes during Florence. Flat coastal plain drains slowly. |
| 3 | Asheville | 71% | 47 F | High | Valley fog, heavy mountain rain, and older housing. Helene’s 2024 flooding soaked thousands of buildings. |
| 4 | Raleigh-Durham | 68% | 51 F | High | Long humid summers and a big stock of vented crawl spaces. Fran (1996) is still the benchmark storm. |
| 5 | Charlotte | 66% | 50 F | Moderate | Driest of the five but still humid by national standards. Summer dew points keep crawl spaces damp. |
Wilmington
Florence made landfall nearby in 2018 and stalled. Surge plus record rain over older coastal housing.
Jacksonville / New Bern
Neuse River surge flooded hundreds of New Bern homes during Florence. Flat coastal plain drains slowly.
Asheville
Valley fog, heavy mountain rain, and older housing. Helene’s 2024 flooding soaked thousands of buildings.
Raleigh-Durham
Long humid summers and a big stock of vented crawl spaces. Fran (1996) is still the benchmark storm.
Charlotte
Driest of the five but still humid by national standards. Summer dew points keep crawl spaces damp.
Why Wilmington tops the ranking. Three factors compound. Humidity: the lower Cape Fear coast posts the highest annual average RH of the state’s reporting stations. Storms: the southern coast is the state’s most frequent landfall zone, and Florence parked over it for two days. Housing: older wood-frame homes downtown and beach rentals up on pilings hold moisture in shaded underfloor framing. On raw humidity Wilmington sits a step behind New Orleans (see our Louisiana report), but its storm cadence keeps the gap narrow.
Why Asheville makes the list with cooler air. Its risk rides on rain, fog, and old houses. Helene’s flooding in September 2024 put parts of the city and nearby river towns underwater and left thousands of soaked buildings drying into winter. Even in a normal year, valley fog, damp basements, and pre-war bungalows on stone foundations keep the moisture load high.
Why Charlotte ranks lowest and still makes the table. Charlotte posts the driest annual average of the five, roughly 66 percent, and the piedmont gets a real break in early spring. The catch is construction: vented crawl spaces are standard across older Charlotte and Raleigh neighborhoods, and summer dew points near 70 F keep those cavities damp even when the rooms above feel dry. Fayetteville barely missed this table for the same reason it floods: the Cape Fear River crested above flood stage in both Hurricane Matthew (2016) and Florence.
Common mold species in North Carolina homes
EPA indoor air guides list the same core species for warm humid climates. North Carolina concentrates five, and the one most people call black mold follows the floods.
Cladosporium
Cladosporium spp.The most common indoor mold nationwide and the usual find on North Carolina crawl space joists, HVAC coils, and supply registers. Olive-green to black. It tolerates cool surfaces, so it colonizes AC condensate lines and duct interiors. EPA lists it as a common allergenic mold.
Aspergillus niger
Aspergillus nigerBlack or dark brown. It prefers damp surfaces with organic dust, which is why it dominates bathroom grout, caulk, and washing-machine gaskets. EPA and CDC flag Aspergillus species as allergens and, in rare cases, a cause of aspergillosis in immunocompromised people.
Stachybotrys chartarum
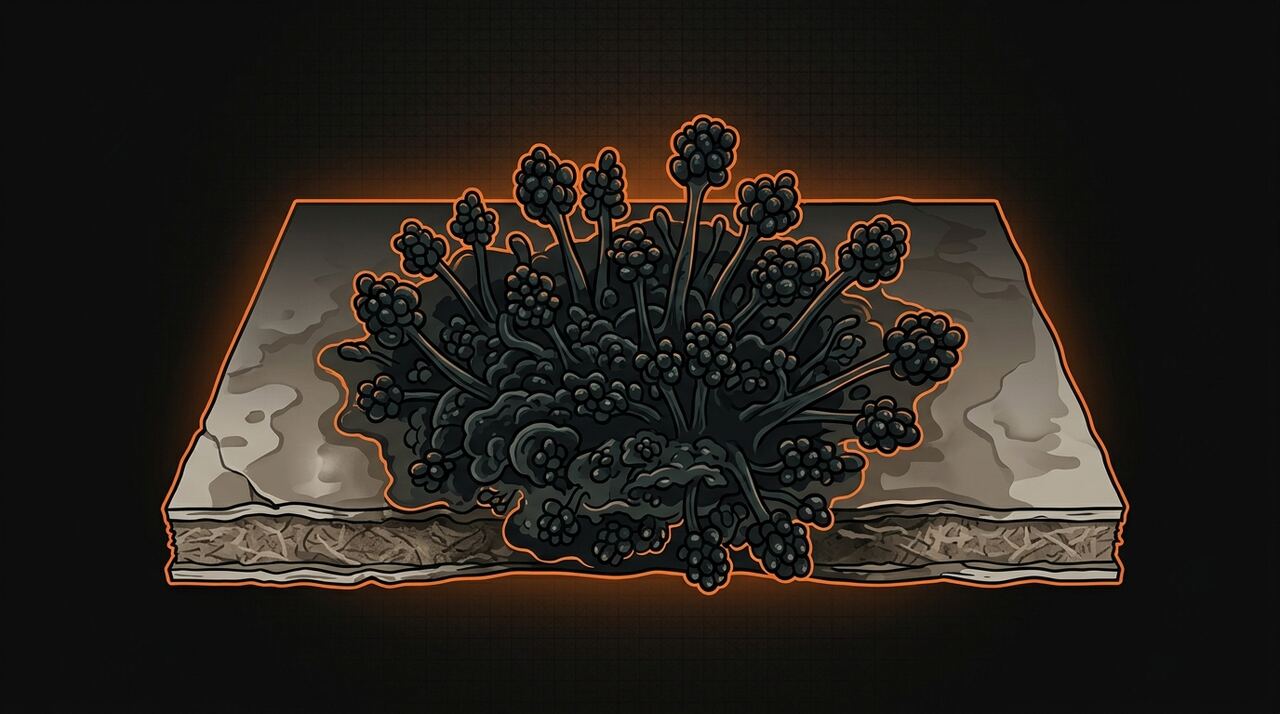
Stachybotrys chartarumThe species commonly called “toxic black mold.” It needs sustained wet cellulose: soaked drywall, ceiling tile, paper-faced insulation. In North Carolina it appears 72+ hours after bulk water from a hurricane, roof leak, or plumbing failure, the post-Florence pattern. Black slimy growth on water-stained drywall means contain and remediate. Do not disturb it.
Penicillium
Penicillium spp.Blue-green. It grows on carpet padding, wallpaper, and damp fabric. Closed-up beach rentals with the AC off give it a long season here. EPA lists Penicillium among the most frequently recovered genera in indoor air samples.
Alternaria
Alternaria alternataDark green to black. It thrives on window tracks, shower stalls, and condensation-prone surfaces, including winter windows in mountain homes. CDC notes mold exposure can trigger asthma symptoms in sensitive people.
Species information is general and informational. Health responses vary. Consult a licensed physician for symptom evaluation. Species sources: EPA Mold Remediation in Schools and Commercial Buildings, EPA A Brief Guide to Mold Moisture and Your Home, CDC National Center for Environmental Health guidance.
North Carolina-specific actions
Three moves cover most of the mold risk reduction available to a North Carolina homeowner. Each maps to a free tool or guide.
A. Fix the crawl space before anything else
If your home sits over a vented crawl space, start there. Check it twice a year with a flashlight and a moisture meter: framing above 16 percent moisture content is in the growth zone. Cover bare ground with overlapped 6-mil poly, fix grading and gutters so rain drains away from the foundation, and consider a sealed crawl space with a small dehumidifier. The crawl space guide walks through the fixes. Habits for the rest of the house live in our mold prevention guide.
B. Run a hurricane-season checklist every June
Before June 1: roof check, gutter clear, HVAC service, room photos for insurance, and active flood coverage (NFIP has a 30-day wait). First 48 hours after a storm: remove standing water, open windows only when outside air is drier, run any working AC or dehumidifier, and photograph all damage. First week: cut out wet drywall a foot above the visible water line, pull saturated insulation and carpet pad, dry framing with air movers, and log moisture readings daily. For anything beyond a small contained area, hire a qualified mold remediation professional (one who follows the IICRC S520 standard; ACAC or RIA credentials and state licenses count too). After cleanup, an ERMI dust test can show whether spore load came back down.
C. Hold indoor RH under 50 percent and scan quarterly
EPA generally advises keeping indoor relative humidity between 30 and 50 percent when possible. Use a reliable hygrometer and repeat readings in different living zones. The Indoor Humidity Context Calculator reports measured RH plus calculated dew point and absolute humidity; it cannot predict growth or identify a hidden source. Persistent odor can justify an appropriate moisture investigation, but odor alone cannot prove concealed mold or locate it.
Seasonal risk profile for North Carolina
Monthly average relative humidity, from NOAA NWS climatological normals 1991-2020. Approximate statewide averages, rounded to whole percents.
North Carolina relative humidity peaks in August
The monthly mean runs from 61 percent in April to 76 percent in August, a 15 point swing across the year.
View the data
| Month | Jan | Feb | Mar | Apr | May | Jun | Jul | Aug | Sep | Oct | Nov | Dec |
|---|---|---|---|---|---|---|---|---|---|---|---|---|
| Mean RH | 66% | 64% | 62% | 61% | 68% | 72% | 74% | 76% | 75% | 71% | 67% | 66% |
A real early-spring dry window makes March and April the best months to dry out a crawl space or basement. The August and September humidity peak lands on top of peak hurricane season.
Where to get help in North Carolina
North Carolina has no widely known state-level mold licensing program; verify current rules with the state health department. The agencies below are the starting points.
Questions on file
Is mold worse in North Carolina than in other states?
It depends on which North Carolina you live in. The coastal plain runs annual average humidity in the low 70s with a real hurricane season, a profile close to the Gulf states. The piedmont metros are a notch milder, and the mountains trade humidity for heavy rain and fog. Every major NC metro sits at or above the national average on NOAA normals, and only Florida, Texas, and Louisiana have taken more hurricane landfalls since 1851.
Source 1, NC Department of Health and Human ServicesHow fast does mold show up after a hurricane or flood in North Carolina?
EPA guidance says growth can start on wet porous materials within 24 to 48 hours. Homes dried within 48 hours with fans and dehumidifiers usually avoid colonization. Homes wet past 72 hours, as thousands were after Hurricane Florence in 2018, grow mold on drywall, insulation, and subfloor. Our mold growth timeline breaks it down hour by hour.
Do mold remediators need a state license in North Carolina?
North Carolina has no widely known state-level mold licensing program; verify current rules with the state health department. A general contractor license may apply to bigger repair jobs, but it covers construction work rather than mold-specific training. Hire a qualified mold remediation professional (one who follows the IICRC S520 standard; ACAC or RIA credentials and state licenses count too).
Source 6, Institute of Inspection, Cleaning and Restoration CertificationWhat are my rights as a renter with mold in North Carolina?
State landlord-tenant law requires rental homes be kept fit and habitable, though no widely known North Carolina statute names mold by itself. Send your landlord written notice with photos and keep copies of everything. Our apartment mold rights guide covers the letter, the timeline, and escalation. For decisions about your lease, talk to a North Carolina attorney or Legal Aid of North Carolina.
Why do North Carolina crawl spaces grow mold?
Vented crawl spaces pull in summer air with dew points near 70 F. That air hits framing and ducts chilled by the AC above, surface humidity spikes, and joists stay damp for months. The fix that holds in this climate is sealing: a ground vapor barrier, closed vents, and a small dehumidifier. The crawl space mold guide has the full inspection and fix list.
Source register
Every source chip on this page points here. Agency and statute pages first, then the federal technical references.
Find the mold in your North Carolina home
The scanner is open. Get a detailed photo report, next steps, testing options and estimated cleanup costs.
Scan My Photo Get the free mold checklistRelated guides on Mold Scanner AI
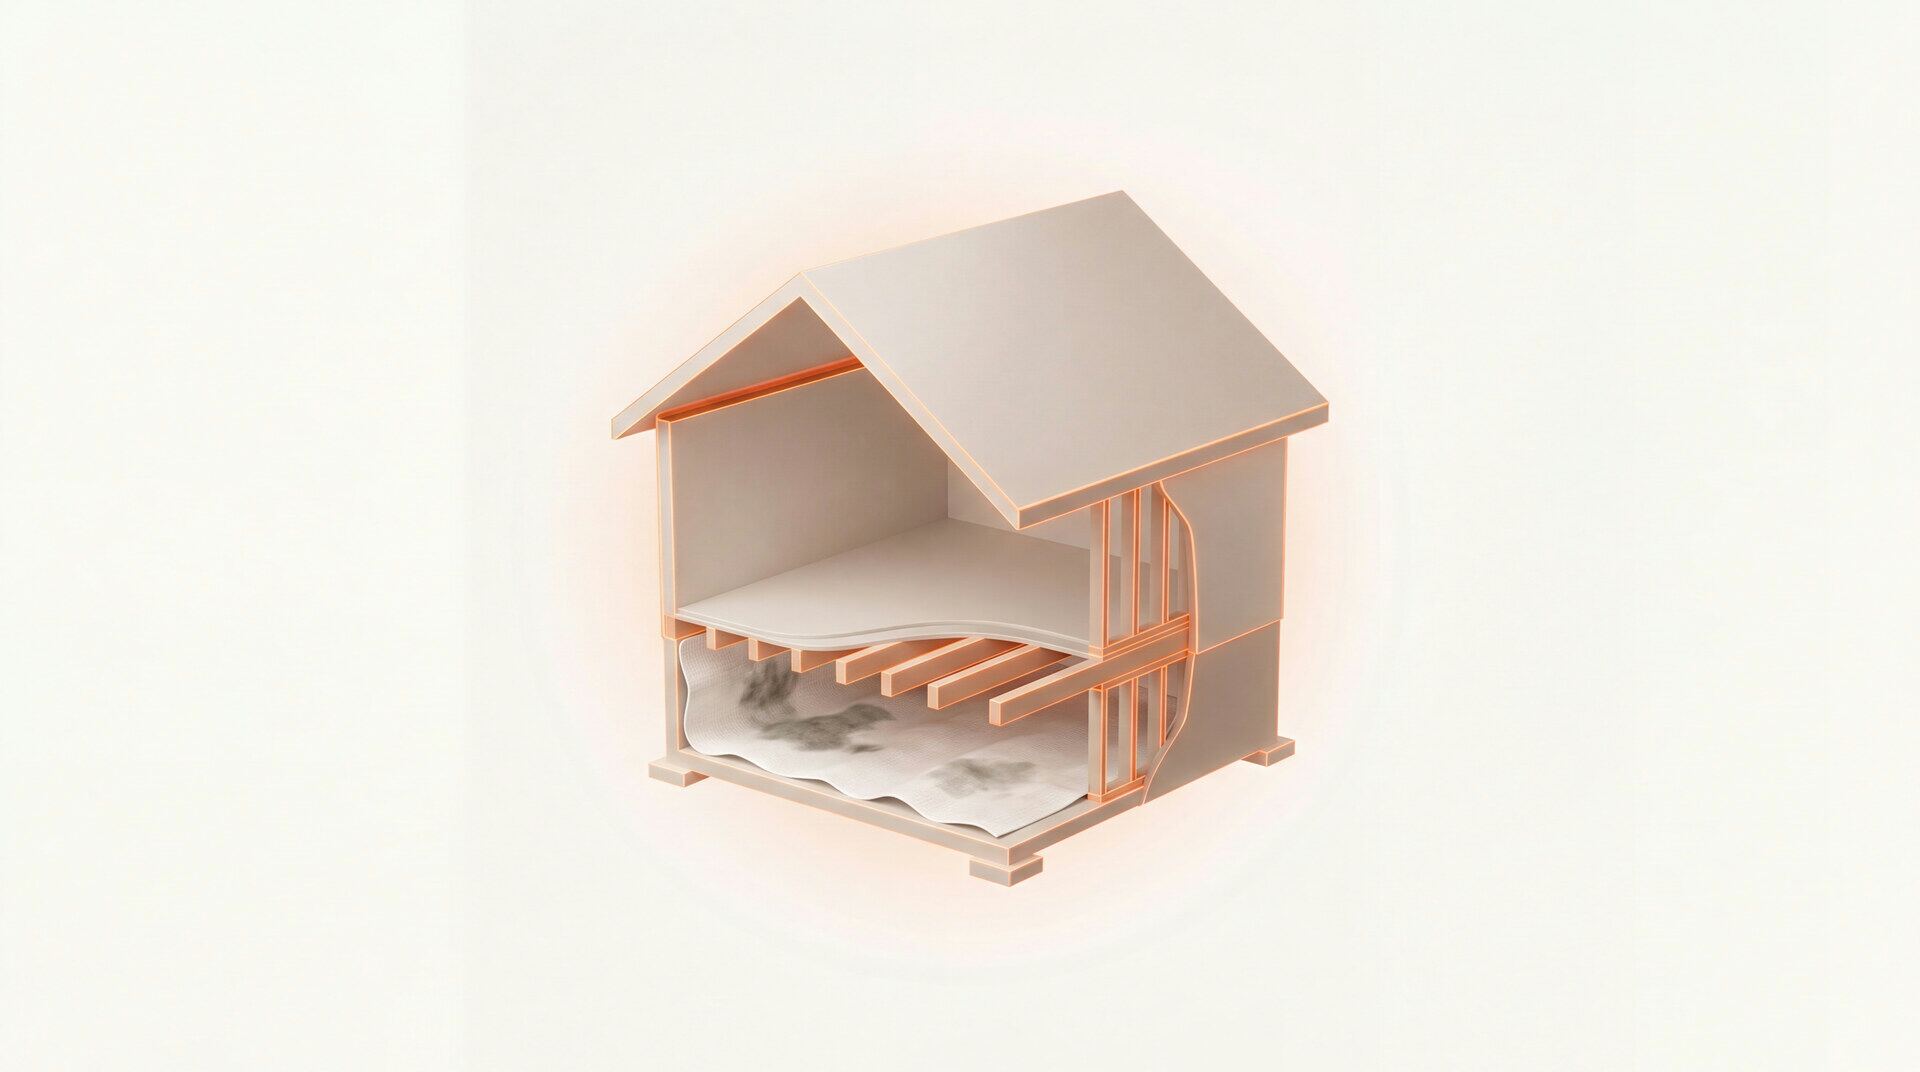
Mold in Crawl Spaces
Inspection steps and fixes for the space under your floor.
Mold in Louisiana
The Gulf Coast benchmark: rankings and humidity data.

Mold Risk by ZIP Code
Type your ZIP, get climate based mold risk.
Picking the Right Dehumidifier
Sizing, drain options, and the spec that matters.
Mold Growth Timeline
Hour by hour: when spores germinate and colonies appear.
Black Mold Guide
What it is, where it grows, and when to worry.