
The New York humidity profile
New York fools people. The cold winters make it feel like a dry-climate state, so homeowners assume mold is a Gulf Coast problem. The data says otherwise. According to NOAA National Weather Service climatological normals for 1991 to 2020, annual average relative humidity across New York metros runs roughly 57 to 72 percent. That is not Louisiana, but it sits at or above the 50 percent indoor-RH threshold EPA flags as the upper safe bound for household humidity for much of the year.
The state's real story is a four-season moisture cycle. In summer, the New York City area turns muggy: dew points climb into the upper 60s and low 70s F, and summer relative humidity in the city often tops 70 percent. A 70 F dew point means the air is fully saturated the moment any surface drops to 70 F, which is exactly what a cool basement wall or a window air-conditioner coil does. Upstate, Lake Erie and Lake Ontario feed lake-effect moisture into Buffalo, Rochester, and Syracuse year-round, which is why Buffalo posts one of the highest annual average relative humidity readings in the state.
Then winter flips the problem. When you heat a New York home, the moist indoor air generated by cooking, showers, and breathing gets trapped, and the moment it touches a cold exterior wall, a single-pane window, or an uninsulated closet wall, it condenses. That is why winter mold in New York shows up along baseboards on exterior walls and behind furniture pushed against cold surfaces. Spring adds a third water source: snowmelt and ice-dam leaks. Heat escaping through the roof melts snow that refreezes at the cold eaves, backing meltwater up under the shingles and into the attic, while the spring thaw drives groundwater up through foundation walls into basements. EPA guidance is blunt about all three: porous materials that stay wet longer than 24 to 48 hours are considered at risk of mold colonization.
New York vs U.S. average
| Metric | New York | U.S. average | Source |
|---|---|---|---|
| Annual avg relative humidity | 57-72% | ~65% | NOAA NWS 1991-2020 |
| Peak summer dew point (NYC area) | 65-72 F | ~50 F annual avg | NOAA NWS 1991-2020 |
| Summer RH (NYC, July-Aug) | 70%+ | ~65% | NOAA NWS 1991-2020 |
| Primary mold drivers | 4 (summer humidity, lake effect, winter condensation, snowmelt) | varies | EPA, NOAA NWS |
| Statewide mold licensing law | Yes (Labor Law Article 32) | most states: none | NYS DOL |
New York's five metros ranked by mold risk
Methodology. Composite risk score = (annual avg RH) × (peak summer dew point) × (cold-climate moisture-cycle weight 1.0 to 1.4 based on lake-effect humidity exposure, winter wall-condensation pressure, and spring snowmelt and ice-dam frequency for the metro). All humidity and dew-point inputs from NOAA NWS 1991-2020 climatological normals for the official airport station serving each metro (New York City, Buffalo KBUF, Rochester KROC, Syracuse KSYR, Albany KALB). Values are approximate climatological normals, not live readings.
Every place on file, ranked by avg RH
Buffalo reads ~72% against ~63% at New York City. The target for a basement is 50 percent, so every row on this chart sits above it.
View the data
| # | Place | Avg RH |
|---|---|---|
| 1 | New York City | ~63% |
| 2 | Buffalo | ~72% |
| 3 | Rochester | ~70% |
| 4 | Syracuse | ~70% |
| 5 | Albany | ~63% |
| # | Metro | Avg RH | Peak summer dew pt | Risk band | Notes |
|---|---|---|---|---|---|
| 1 | New York City | ~63% | 65-72 F | Extreme | Highest summer dew-point load in the state plus the oldest, densest housing stock. Pre-war apartments, cellars, and ground-floor units stay damp. |
| 2 | Buffalo | ~72% | 62-66 F | Extreme | Highest annual average RH in the state. Lake Erie keeps air moist year-round, and heavy snow loads drive ice-dam and snowmelt intrusion. |
| 3 | Rochester | ~70% | 62-65 F | Very high | Downwind of Lake Ontario. Persistent lake-effect humidity and snow, plus older Rust Belt housing with limited vapor barriers. |
| 4 | Syracuse | ~70% | 62-65 F | Very high | Among the snowiest U.S. metros. Lake Ontario lake effect plus extreme snowmelt make spring foundation and attic moisture the headline risk. |
| 5 | Albany | ~63% | 62-65 F | High | Drier Capital Region air pulls the annual average down, but cold winters and older housing make winter wall condensation the dominant driver. |
New York City
Highest summer dew-point load in the state plus the oldest, densest housing stock. Pre-war apartments, cellars, and ground-floor units stay damp.
Buffalo
Highest annual average RH in the state. Lake Erie keeps air moist year-round, and heavy snow loads drive ice-dam and snowmelt intrusion.
Rochester
Downwind of Lake Ontario. Persistent lake-effect humidity and snow, plus older Rust Belt housing with limited vapor barriers.
Syracuse
Among the snowiest U.S. metros. Lake Ontario lake effect plus extreme snowmelt make spring foundation and attic moisture the headline risk.
Albany
Drier Capital Region air pulls the annual average down, but cold winters and older housing make winter wall condensation the dominant driver.
Why New York City tops the ranking. Three independent factors compound. First, summer moisture: the NYC area has the highest summer dew points in the state, and city summer relative humidity routinely tops 70 percent, which keeps cellars, ground-floor units, and air-conditioned rooms damp. Second, housing stock: the five boroughs are dominated by century-old brownstones, pre-war and post-war apartment buildings, and below-grade units with masonry walls that wick groundwater and condense humid air. Third, density and shared systems: in large apartment buildings a single hidden leak or a chronically damp cellar can feed mold across multiple units, which is part of why New York City added its own indoor-allergen rules on top of the statewide law.
Why Buffalo is a close second. Buffalo posts one of the highest annual average relative humidity readings of any New York reporting station because Lake Erie loads the air with moisture every month of the year. Add the region's famous snowfall, which produces repeated freeze-thaw, ice-dam, and snowmelt water events, and you get a metro where the air is rarely dry and the roof and foundation are under constant moisture pressure. Rochester and Syracuse follow the same Lake Ontario pattern, with Syracuse's extreme snow totals pushing spring snowmelt to the top of its risk list.
Why Albany ranks lowest but is still "high". The Capital Region sees drier continental air more often than the lake cities or the coast, which pulls its annual average RH down. The trade-off is some of the coldest winters in the group combined with older housing that often lacks modern vapor barriers and balanced ventilation. When warm indoor air meets those cold walls and windows, condensation feeds mold along baseboards and in closets just as reliably as summer humidity does elsewhere.
Common mold species in New York homes
Every EPA indoor air quality guide lists the same core species for cool, humid, four-season climates. New York homes concentrate five of them, with basements as the usual epicenter.
Cladosporium
Cladosporium spp.The most common indoor mold nationwide and a regular in New York basements, bathrooms, and around windows. Olive-green to black. It tolerates cold surfaces, so it readily colonizes cool basement walls, window sills, and AC condensate areas. EPA lists it as a common allergenic mold.
Penicillium
Penicillium spp.Blue-green and velvety. The Penicillium and Aspergillus group is the species most frequently recovered from New York indoor air, and basements are the most affected zone. It grows on damp carpet padding, wallpaper, insulation, and cardboard, which is why New York cellars and below-grade storage are prime habitat. EPA lists it among the most common indoor genera.
Aspergillus
Aspergillus spp.Often grouped with Penicillium on air panels. Found on damp drywall, dust-laden surfaces, and HVAC components in New York homes. EPA and CDC flag Aspergillus species as allergens and, in rare cases, as a cause of aspergillosis in immunocompromised individuals.
Stachybotrys chartarum
Stachybotrys chartarumThe species commonly called “toxic black mold.” Requires sustained wet cellulose such as wet drywall, wet ceiling tile, or paper-faced insulation. In New York it most often appears after a basement flood, a roof or ice-dam leak, or a long-running plumbing leak. When to worry: visible black slimy growth on water-stained drywall after a leak or flood. Do not disturb it. Contain and remediate.
Alternaria
Alternaria alternataDark green to black. Thrives around windows, shower stalls, and any condensation-prone surface, which makes it common in New York winters when warm indoor air condenses on cold glass. Commonly flagged on allergenic panels, often correlating with asthma exacerbation in sensitive individuals.
Species information is general and informational. Health responses vary. Consult a physician for symptom evaluation. Species sources: EPA Mold Remediation in Schools and Commercial Buildings, EPA A Brief Guide to Mold Moisture and Your Home, CDC National Center for Environmental Health guidance, NYC Department of Health mold guidance.
New York-specific actions
Three actions account for most of the mold risk reduction available to a New York homeowner. Each maps to an existing free Mold Scanner AI tool.
A. Treat the basement as ground zero, year-round
In New York, the basement is the single most predictable mold site. Summer: run a dehumidifier sized to the space and keep the basement below 55 percent RH, because humid outdoor air condenses on cool foundation walls. Winter: watch for condensation where heated air meets cold rim joists and uninsulated walls. Spring: after the thaw, check for groundwater wicking up through the foundation and for staining at the base of walls. Seal foundation cracks, keep gutters and downspouts clear and discharging away from the house, and dry any wet material within 24 to 48 hours with a dehumidifier and air movers.
B. Win the winter condensation fight
New York winter mold is a condensation problem, not a flood problem. Keep indoor humidity low enough that moist air does not condense on cold surfaces, often closer to 30 to 40 percent in deep winter. Pull furniture a few inches off exterior walls so air can circulate, run bath and kitchen exhaust fans, and after any snow event check the attic and upper exterior walls for ice-dam and roof leaks. Materials that still read above 16 percent moisture content after 48 to 72 hours of drying should be removed.
C. Scan quarterly, especially at the seasonal switchovers
New York's four high-risk quarters are July (peak summer humidity and dew point), January (cold-wall winter condensation), March (snowmelt, ice dams, and the spring thaw), and the HVAC switchover months when neither heat nor AC is managing humidity well.
Seasonal risk profile for New York
Approximate monthly average RH across the five reporting stations, expressed as the statewide blended normal. Based on NOAA NWS climatological normals 1991-2020. The shape matters as much as the level: New York humidity dips in spring, climbs through a muggy summer, and stays elevated through the lake-effect fall and winter upstate.
New York relative humidity peaks in August
The monthly mean runs from 62 percent in April to 72 percent in August, a 10 point swing across the year.
View the data
| Month | Jan | Feb | Mar | Apr | May | Jun | Jul | Aug | Sep | Oct | Nov | Dec |
|---|---|---|---|---|---|---|---|---|---|---|---|---|
| Mean RH | 70% | 68% | 65% | 62% | 65% | 68% | 70% | 72% | 72% | 71% | 71% | 71% |
No month in New York is truly dry. Summer mugginess and lake-effect fall and winter humidity keep the blended average near or above 65 percent most of the year, while winter swaps surface humidity for cold-wall condensation. Mold risk is continuous; the water source just changes with the season.
Where to get help in New York
New York is one of the few states with a statewide mold licensing law. Under Article 32 of the New York Labor Law, which took effect January 1, 2016, anyone performing mold assessment or mold remediation on a project of 10 square feet or more must be licensed by the New York State Department of Labor, and the assessor and the remediation contractor must be separate, independent parties. A residential property owner working on their own property is exempt. New York City layers its own indoor-allergen rules on top through Local Law 55. This is general information, not legal advice. Read the statute and the agency pages below directly.
Questions on file
Is mold a real problem in New York, even with the cold winters?
Yes. New York's mold risk runs all four seasons, not just summer. NOAA humidity normals put annual average relative humidity between roughly 57 and 72 percent across New York metros, and summer dew points in the New York City area routinely climb into the upper 60s and low 70s F, which is muggy enough to keep basements and ground-floor walls above the EPA 50 percent indoor-RH safe bound. In winter the problem flips: warm indoor air meets cold exterior walls and windows and condenses, feeding mold along baseboards and behind furniture. Spring snowmelt and ice-dam leaks add a third water source. The cold does not stop mold, it just moves where mold grows.
Source 7, , National Oceanic and Atmospheric AdministrationWhy is Buffalo so humid compared to the rest of the state?
Lake effect. Buffalo sits at the eastern end of Lake Erie, and Rochester and Syracuse sit downwind of Lake Ontario. Those Great Lakes pump moisture into the air year-round, which is why Buffalo posts one of the highest annual average relative humidity readings of any New York reporting station in the NOAA 1991 to 2020 normals. The same lake moisture that drives Buffalo's famous snowfall also keeps indoor and basement humidity elevated through the shoulder seasons.
Source 7, , National Oceanic and Atmospheric AdministrationDoes New York have a mold law?
Yes. New York is one of the few states with a statewide mold statute. Article 32 of the New York Labor Law, which took effect January 1, 2016, requires that anyone performing mold assessment or mold remediation on a project of 10 square feet or more be licensed by the New York State Department of Labor. The law also requires that the mold assessor and the mold remediation contractor be separate, independent parties on the same job. A residential property owner working on their own property, and certain owners or employees on buildings they own, are exempt under the statute. This is general information, not legal advice. Read Article 32 and the NYS DOL Mold Program page directly, and consult a licensed professional for your specific situation.
Do I need a licensed contractor for mold in my New York home?
It depends on the size of the job and who is doing the work. Under Article 32 of the New York Labor Law, mold projects of 10 square feet or more generally require a New York State licensed mold assessor and a separate licensed mold remediation contractor. A homeowner remediating mold on their own property is exempt from the licensing requirement under the statute. For anything larger than a small contained patch, or anything you are not equipped to handle safely, a NYS-licensed professional is the standard path. This is general information, not legal advice.
What New York mold species should I watch for?
Cladosporium, Penicillium, and Aspergillus are the species most often recovered from New York indoor air and basement samples. Stachybotrys chartarum, the mold commonly called black mold, appears after sustained water intrusion such as a basement flood, a roof or ice-dam leak, or a long-running plumbing leak. Alternaria rounds out the typical panel and is common around windows and shower stalls. EPA notes all molds can cause reactions in sensitive people. See a physician for symptom evaluation. This page is general information, not medical advice.
What is the best humidity level for a New York home?
EPA guidance is 30 to 50 percent indoor relative humidity. In a New York summer, aim for the lower end with air conditioning and a dehumidifier, especially in basements where 60 percent or higher is common. In a New York winter, the goal flips: keep indoor humidity low enough (often closer to 30 to 40 percent) that moist indoor air does not condense on cold windows and exterior walls. Use a hygrometer in the basement and in any room with an exterior wall, and add dehumidification anywhere a reading sits above 55 percent.
Does my renters or homeowners insurance cover mold in New York?
General information only. New York policies vary widely on mold. Most standard policies exclude mold unless it results from a covered sudden and accidental water event, such as a burst pipe, and many cap mold remediation coverage at a low dollar limit. Flooding from heavy rain or snowmelt is typically excluded from standard policies and requires separate flood coverage. Read your own policy and consult a licensed New York insurance agent or attorney. The New York State Department of Financial Services publishes consumer insurance guidance.
How much does mold remediation cost in New York?
New York pricing tends to run above national averages, especially in the New York City metro, because of labor costs, disposal rules, and the Article 32 requirement for a separate licensed assessor and clearance testing. Small contained jobs under roughly 100 square feet commonly run about 1,500 to 5,000 USD. Whole-home or multi-room remediation after a basement flood or sustained leak can reach 10,000 to 30,000 USD or more when drywall, insulation, subfloor, and finishes need replacement. Budget separately for the required mold assessment and post-remediation clearance testing. Always use NYS-licensed contractors who follow the IICRC S520 standard. See our remediation cost guide for a detailed breakdown.
Where does mold hide in a New York house?
Basements and cellars first, because foundation walls wick groundwater and stay cool enough to condense humid summer air. After that: behind furniture on cold exterior walls and inside unventilated closets in winter, around windows where warm indoor air condenses, in attics after ice-dam or roof leaks, and in bathrooms and kitchens year-round. New York's older pre-war and post-war housing stock often lacks modern vapor barriers and balanced ventilation, which lets all of these spots stay damp longer than they should.
Source register
Every source chip on this page points here. Agency and statute pages first, then the federal technical references.
Find the mold in your New York home
The scanner is open. Get a detailed photo report, next steps, testing options and estimated cleanup costs.
Scan My Photo Get the free mold checklistRelated guides on Mold Scanner AI

Mold Risk by ZIP Code
Type your ZIP, get climate based mold risk.

Water Damage Documentation Helper
Record accessible water-event conditions without a risk score.
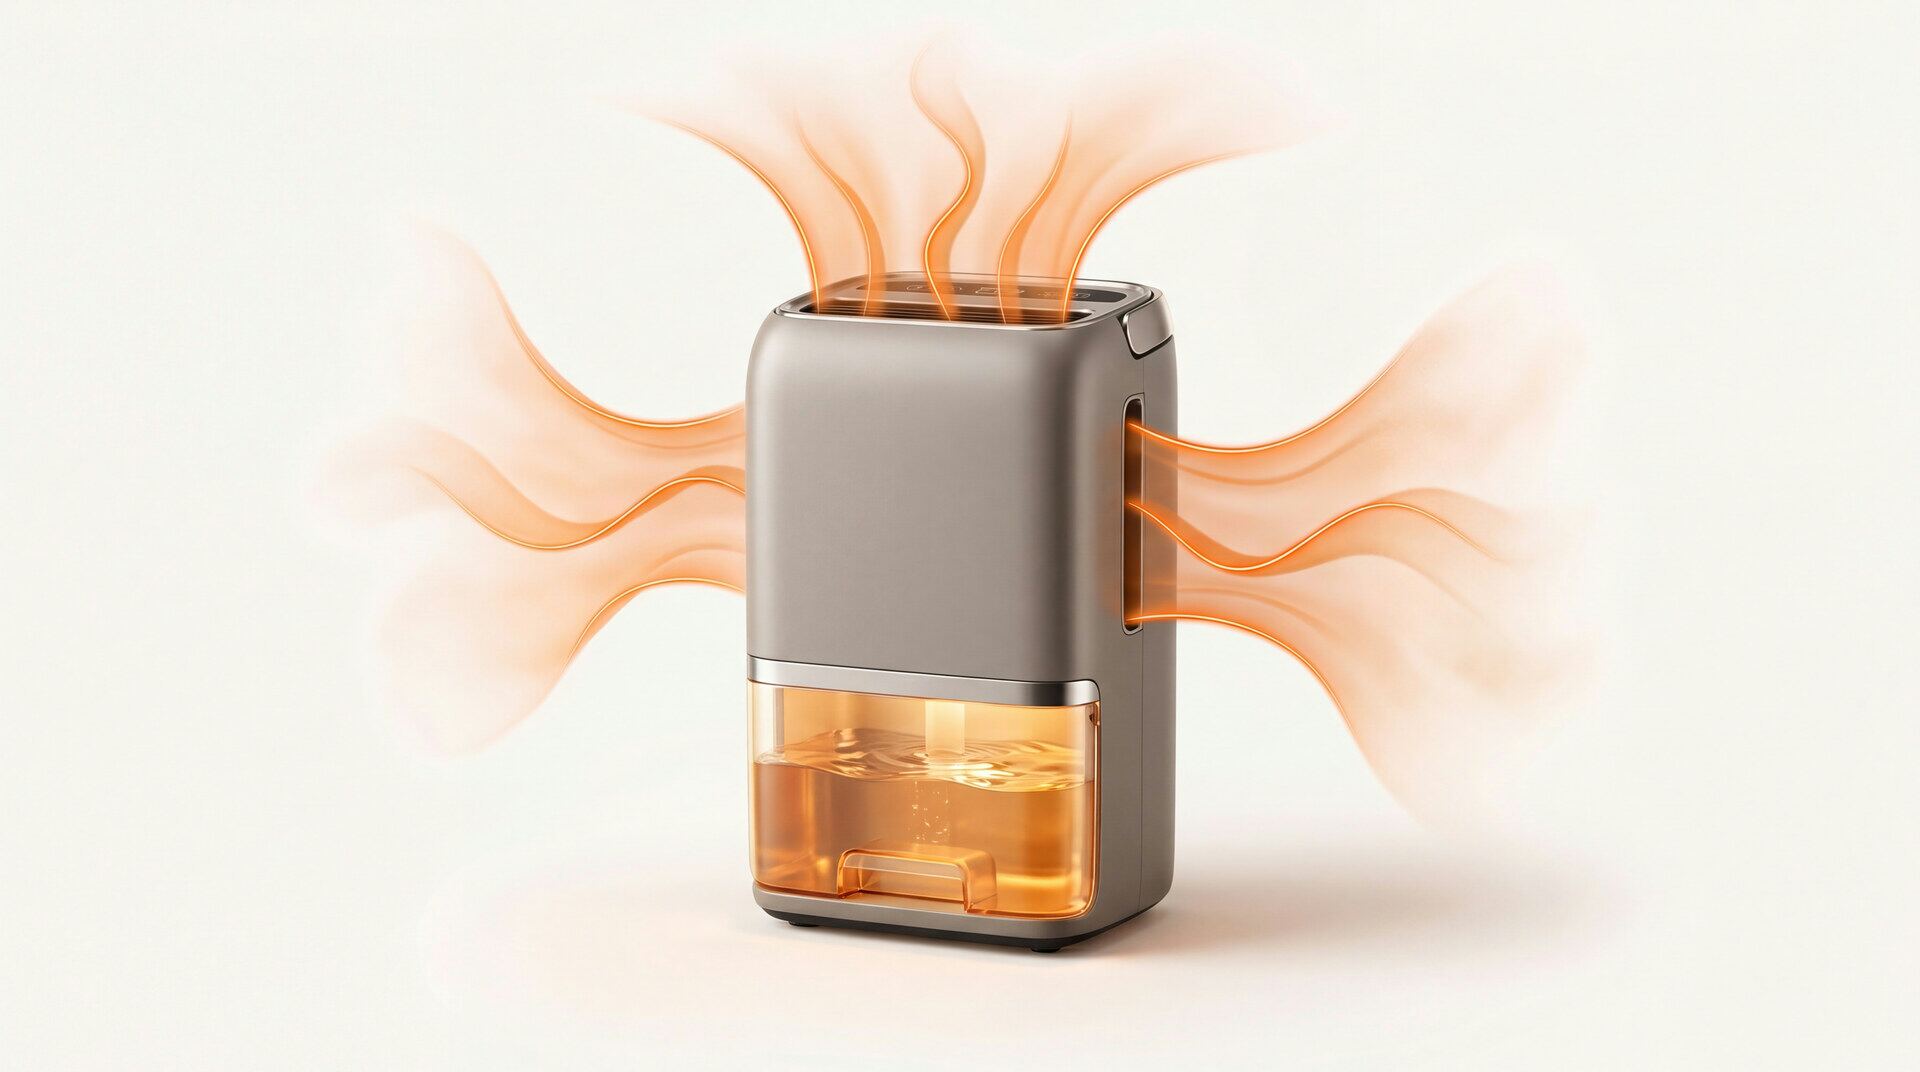
Picking the Right Dehumidifier
Sizing, drain options, and the spec that matters.
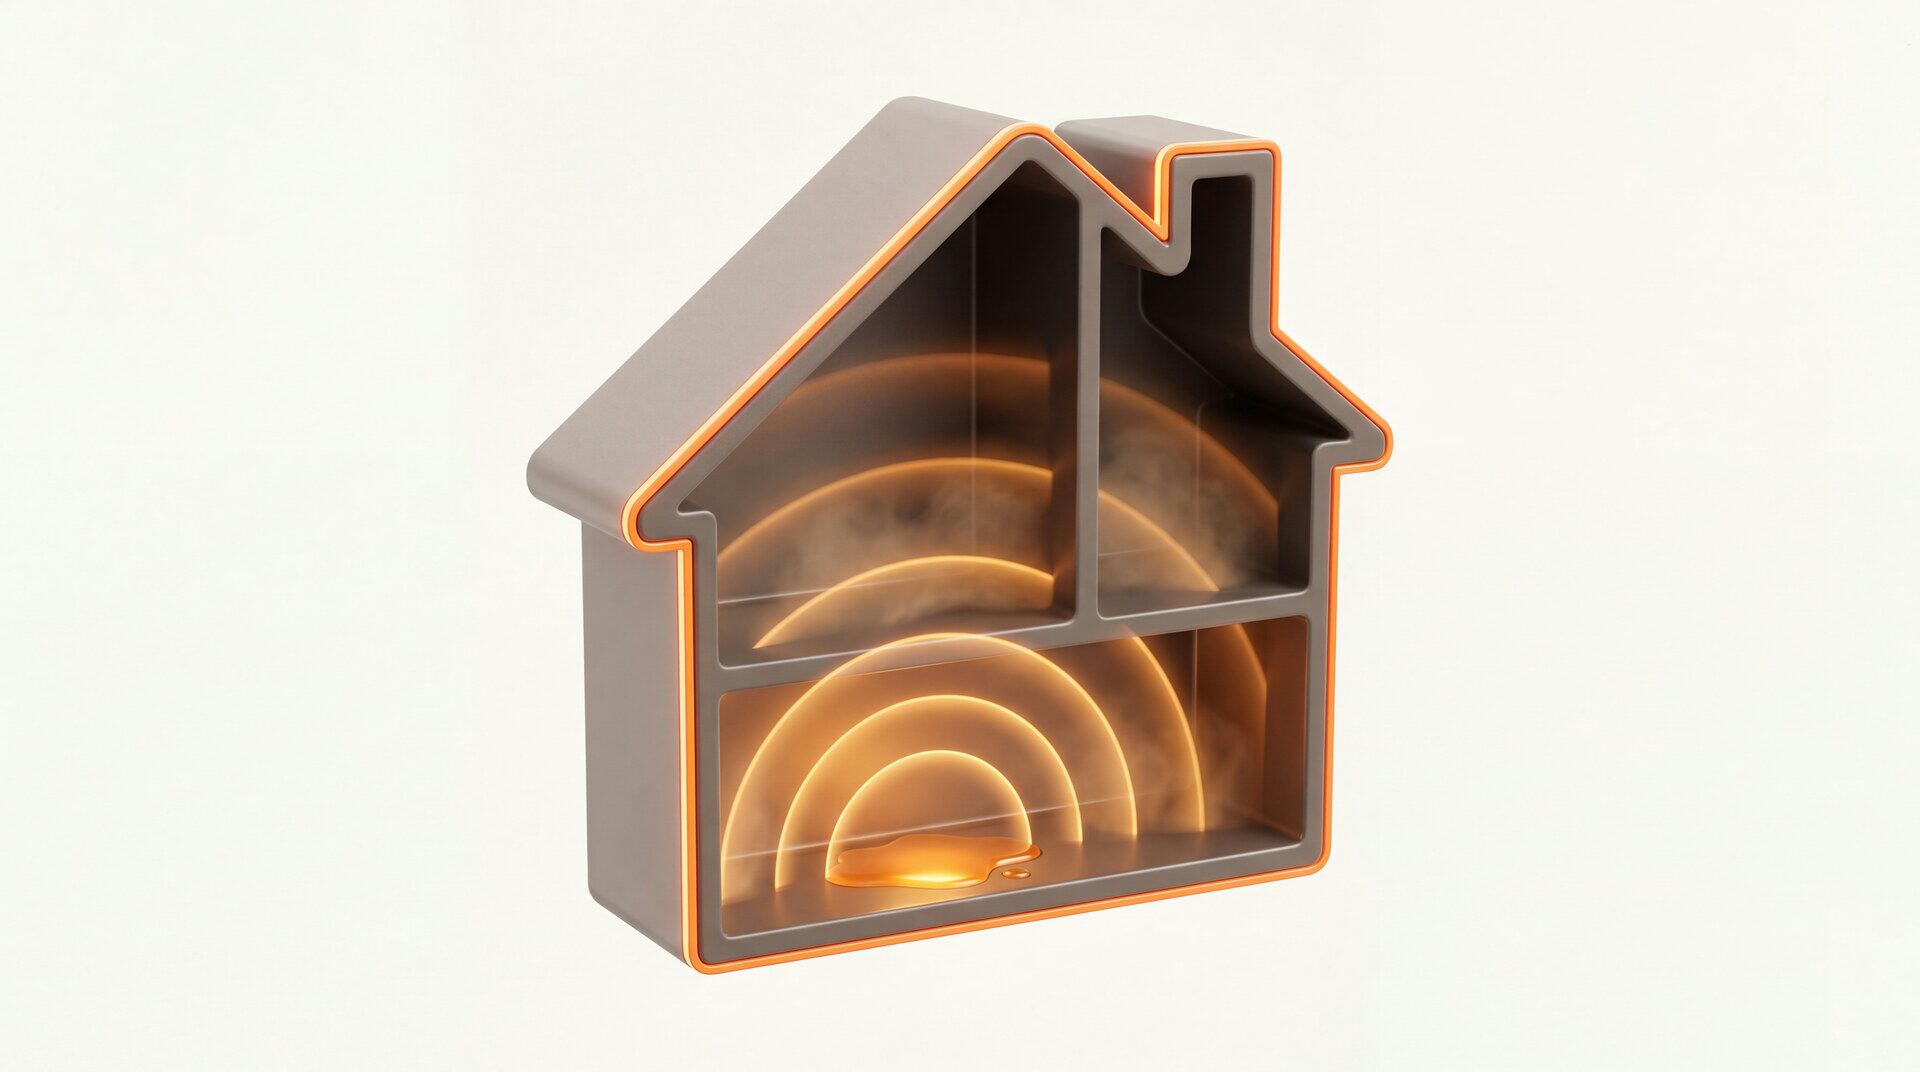
Mold Growth Timeline
Hour by hour: when spores germinate and colonies appear.
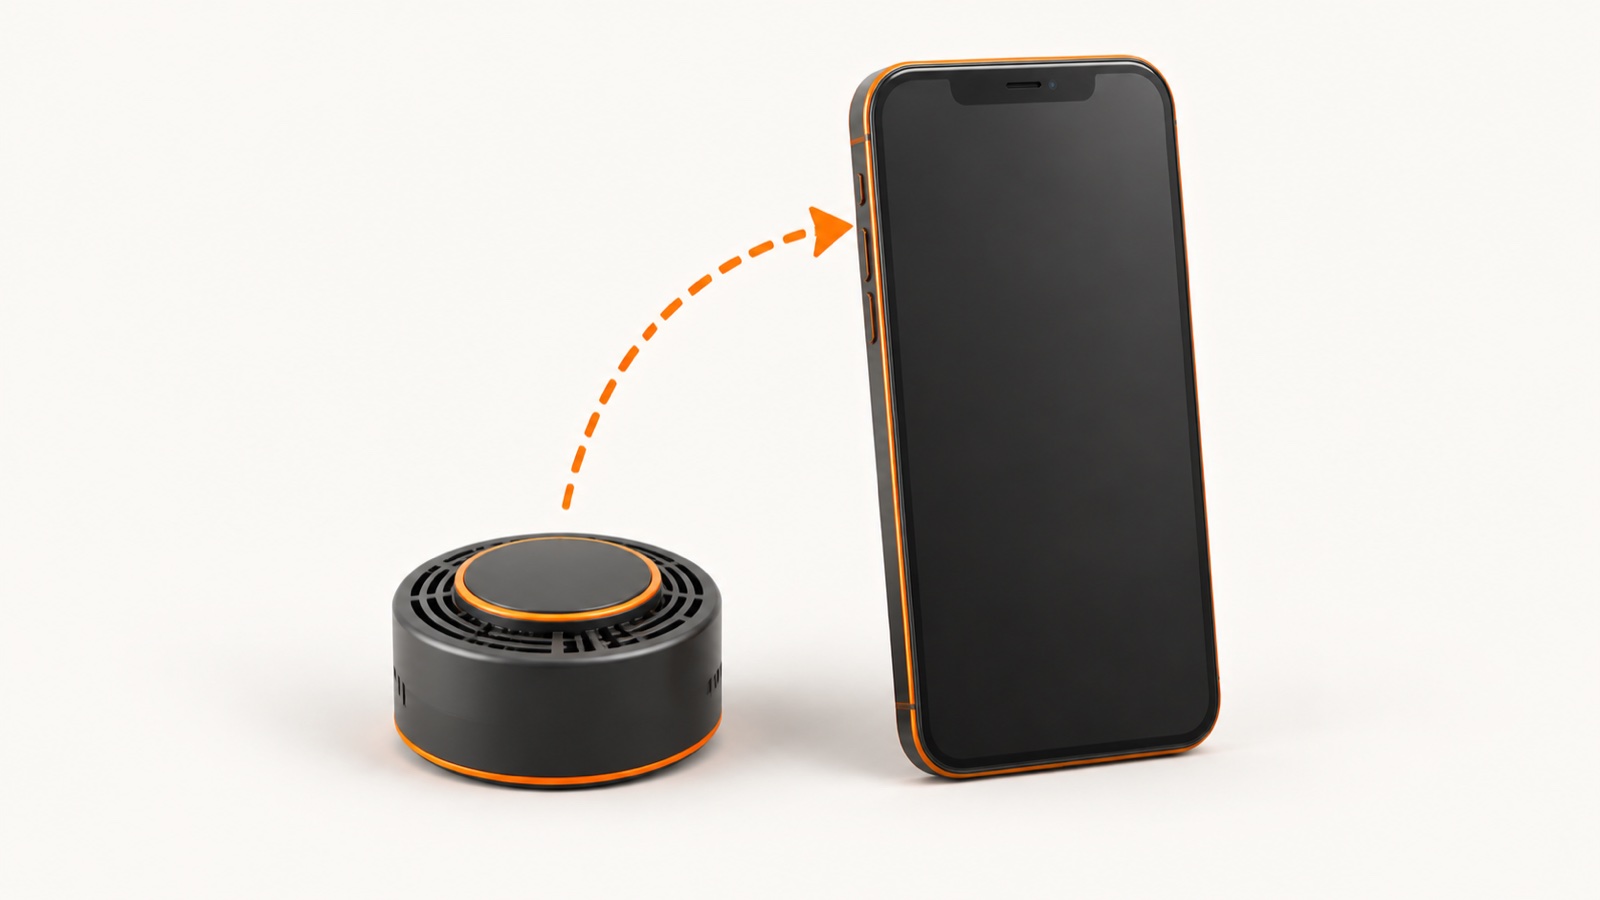
Indoor Humidity from Your Phone
What works, what does not, and a free alternative.

Stop Mold in a Closed Up House
Vacation home, rental, second property.