
The Mississippi humidity profile
Mississippi touches the Gulf along a short strip of coast, but the whole state lives in Gulf air. Warm, wet wind rolls in off the water all year and rides north past Jackson before it thins out. In NOAA National Weather Service climatological normals for 1991 to 2020, Mississippi’s major metros post annual average relative humidity in the 71 to 75 percent range. That’s several points above the U.S. average and far above the 50 percent indoor ceiling EPA recommends for homes.
Rain is the second half of the story. Mississippi ranks among the rainiest states in the country. Annual totals run from the mid 50s in inches up north to 65 or more on the coast, against a national average near 30. Each system that stalls over the state loads roofs, walls, slabs, and crawl spaces with water. EPA guidance says wet porous materials can start growing mold within 24 to 48 hours, so every soaking starts a clock.
Then there are the storms people remember. Hurricane Camille came ashore near Pass Christian in 1969 as a Category 5. Hurricane Katrina’s 2005 storm surge, nearly 28 feet at Pass Christian and the highest in U.S. records, wrecked block after block of Gulfport, Biloxi, Waveland, and Bay St. Louis. Katrina was still a hurricane when it crossed the Pine Belt near Hattiesburg, and the mold that followed filled homes from the beach to Jackson. Neighboring Louisiana runs a few points wetter, but Mississippi’s mix of humidity, rainfall, and surge history puts it in the same risk tier.
Mississippi vs U.S. average
| Metric | Mississippi | U.S. average | Source |
|---|---|---|---|
| Annual avg relative humidity | 71 to 75% | ~65% | NOAA NWS 1991 to 2020 |
| Annual avg dew point | 57 to 63 F | ~50 F | NOAA NWS 1991 to 2020 |
| Days/year above 70% RH | 180 to 230 | ~120 | NOAA NWS 1991 to 2020 |
| Annual rainfall | 55 to 65+ in | ~30 in | NOAA NWS 1991 to 2020 |
| Category 5 landfalls in U.S. records | 1 (Camille, 1969) | 4 nationwide | NOAA NHC |
Mississippi’s five metros ranked by mold risk
Methodology. Composite risk score = (annual avg RH) × (days/year above 70 percent RH) × (storm-exposure weight 1.0 to 1.5 based on NOAA NHC historical track density and river-flood history within 50 miles of the metro centroid). Humidity values are approximate, from NOAA 1991-2020 normals for the airport station serving each metro, rounded to the nearest whole percent. The ranking itself is editorial: humidity, storm and flood exposure, and housing stock weighed together.
Every place on file, ranked by avg RH
Gulfport-Biloxi reads 75% against 71% at Tupelo. The target for a basement is 50 percent, so every row on this chart sits above it.
View the data
| # | Place | Avg RH |
|---|---|---|
| 1 | Gulfport-Biloxi | 75% |
| 2 | Hattiesburg | 74% |
| 3 | Jackson | 73% |
| 4 | Meridian | 73% |
| 5 | Tupelo | 71% |
| # | Metro | Avg RH | Avg dew pt | Risk band | Notes |
|---|---|---|---|---|---|
| 1 | Gulfport-Biloxi | 75% | 63 F | Extreme | Camille and Katrina surge zone. Salt air, high water table, post-storm rebuild patchwork. |
| 2 | Hattiesburg | 74% | 61 F | Very high | Pine Belt rainfall corridor. Katrina crossed it at hurricane strength. Large stock of mid-century wood-frame rentals. |
| 3 | Jackson | 73% | 60 F | Very high | Pearl River flood history (1979, 2020, 2022). Yazoo clay shifts foundations and cracks plumbing. |
| 4 | Meridian | 73% | 59 F | High | Historic early-1900s housing stock, aging HVAC, heavy spring and summer rain. |
| 5 | Tupelo | 71% | 57 F | High | Driest of the five, still humid by national standards. Pier-and-beam homes hold crawl-space moisture. |
Gulfport-Biloxi
Camille and Katrina surge zone. Salt air, high water table, post-storm rebuild patchwork.
Hattiesburg
Pine Belt rainfall corridor. Katrina crossed it at hurricane strength. Large stock of mid-century wood-frame rentals.
Jackson
Pearl River flood history (1979, 2020, 2022). Yazoo clay shifts foundations and cracks plumbing.
Meridian
Historic early-1900s housing stock, aging HVAC, heavy spring and summer rain.
Tupelo
Driest of the five, still humid by national standards. Pier-and-beam homes hold crawl-space moisture.
Why Gulfport-Biloxi tops the ranking. Three factors stack. Humidity first: the coastal strip posts the state’s highest readings, with Gulf air on top of it every month. Surge second: Camille in 1969 and Katrina in 2005 both pushed Gulf water deep into neighborhoods, and a soaked house that can’t dry fast is a mold incubator. Housing third: the coast is a patchwork of older raised cottages and post-Katrina rebuilds, sitting on damp soil with a high water table. Crawl spaces and wall cavities here stay wet longer than almost anywhere else in the state.
Why Tupelo lands last but still rates high. Northeast Mississippi gets more dry continental air than the coast, which pulls Tupelo’s annual average down to about 71 percent. That number would still lead most states outside the South. Spring storm season brings hard rain, summer dew points climb fast, and a large share of older homes sit on pier-and-beam foundations where crawl-space moisture collects. Less risk than the coast, but nowhere near low.
Common mold species in Mississippi homes
EPA’s indoor air quality guides list the same core species for warm humid climates, and Mississippi homes concentrate five of them. One of them, Stachybotrys, is the one people call black mold.
Cladosporium
Cladosporium spp.The most common indoor mold nationwide and the usual find on Mississippi HVAC evaporator coils, condensate pans, and supply registers. Olive-green to black. It tolerates cool surfaces, so it settles into duct interiors and AC drain lines. EPA lists it as a common allergenic mold.
Aspergillus
Aspergillus spp.Black to dark brown, common on bathroom grout, caulk, and washing-machine gaskets across the humid South. It feeds on damp organic dust. EPA and CDC flag Aspergillus species as allergens and, in rare cases, as a cause of aspergillosis in people with weakened immune systems.
Stachybotrys chartarum
Stachybotrys chartarumThe species behind the “toxic black mold” label. It needs cellulose that stays wet for days: soaked drywall, ceiling tile, paper-faced insulation. In Mississippi it shows up after floods, roof failures, and plumbing leaks, and it was the signature post-Katrina species on the coast. If you see black slimy growth on water-stained drywall, don’t disturb it. Contain the area and bring in help.
Penicillium
Penicillium spp.Blue-green. It grows on carpet padding, wallpaper, and damp fabric. Mississippi’s long mild shoulder seasons, when the AC barely runs but the air stays damp, give it months of working time in older homes. EPA lists Penicillium among the most frequently recovered genera in indoor air samples.
Alternaria
Alternaria alternataDark green to black. It favors window tracks, shower stalls, and any surface where condensation lingers. Allergy panels flag it often, and EPA’s remediation guide names it one of the dominant indoor genera in humid climates.
Species information is general and informational. Health responses vary, and symptom guidance here comes from CDC and EPA materials. See a licensed physician for symptom evaluation. Sources: EPA Mold Remediation in Schools and Commercial Buildings, EPA A Brief Guide to Mold, Moisture and Your Home, CDC National Center for Environmental Health.
Mississippi-specific actions
Three moves cover most of the risk. The full cleanup playbook lives in our how to get rid of mold guide, and the year-round routine is in how to prevent mold. Each step below maps to a free Mold Scanner AI tool.
A. Run a hurricane-season checklist every June
Before the season (by June 1): Inspect the roof, clear gutters, service the HVAC, photograph rooms and contents, and confirm flood coverage (NFIP policies carry a 30-day waiting period). First 48 hours after a storm: Remove standing water, open windows only when outdoor air is drier than indoor, run any working AC or a dehumidifier, and photograph all damage. First 7 days: Cut out wet drywall a foot above the water line, pull saturated insulation and carpet padding, dry framing with air movers, and log moisture-meter readings daily. Wood that still reads above 16 percent moisture after 72 hours of drying should come out. If the affected area runs past about 10 square feet, EPA says skip the DIY route: hire a qualified mold remediation professional (one who follows the IICRC S520 standard; ACAC or RIA credentials and state licenses count too).
B. Keep indoor RH below 50 percent year-round
Use a reliable hygrometer and repeat readings in different living zones. EPA generally advises keeping indoor relative humidity between 30 and 50 percent when possible. Our Indoor Humidity Context Calculator reports measured RH plus calculated dew point and absolute humidity without a mold-risk score.
C. Check the crawl space, then scan quarterly
Many older Mississippi homes stand on pier-and-beam foundations over bare soil, and that’s where damp problems start. Look under the house twice a year for standing water, sagging insulation, and white or fuzzy growth on joists; our crawl space guide covers vapor barriers and vents. If rooms smell musty but the walls look clean, read the mold behind walls guide, and consider an ERMI dust test for a whole-house read. To see your local climate baseline, type your ZIP into the mold risk by ZIP tool. The four highest-risk check-ins: June (season start), September (peak hurricane season), January (condensation on cold mornings), and April (spring rain).
Seasonal risk profile for Mississippi
Monthly average relative humidity, approximate statewide averages from NOAA NWS climatological normals 1991 to 2020, rounded to whole percents.
Mississippi relative humidity peaks in July
The monthly mean runs from 71 percent in March to 78 percent in July, a 7 point swing across the year.
View the data
| Month | Jan | Feb | Mar | Apr | May | Jun | Jul | Aug | Sep | Oct | Nov | Dec |
|---|---|---|---|---|---|---|---|---|---|---|---|---|
| Mean RH | 76% | 73% | 71% | 71% | 74% | 76% | 78% | 78% | 76% | 73% | 74% | 77% |
Even the driest stretch, March through April and again in October, sits around 71 to 73 percent. Mississippi has no dry season. Mold risk runs all year; hurricanes and river floods are accelerants, not the only cause.
Where to get help in Mississippi
Mississippi has no widely known state-level mold licensing program; verify current rules with the Mississippi State Department of Health. The agencies below are the authoritative starting points.
Questions on file
Is mold risk worse in Mississippi than in other states?
It sits near the top. Mississippi metros average 71 to 75 percent annual relative humidity in NOAA 1991 to 2020 normals, and the state gets some of the heaviest rainfall in the country. That keeps surfaces above the moisture line EPA flags for mold growth for most of the year. Only a few Gulf states, Louisiana among them, run consistently wetter.
Source 4, National Oceanic and Atmospheric AdministrationDoes Mississippi license mold remediation companies?
Mississippi has no widely known state-level mold licensing program; verify current rules with the Mississippi State Department of Health. Because the state doesn’t screen this trade for you, hire a qualified mold remediation professional (one who follows the IICRC S520 standard; ACAC or RIA credentials and state licenses count too) and ask for that documentation before work starts.
What can renters in Mississippi do about mold?
Mississippi has no mold-specific landlord-tenant standard we can point to with confidence, so paper matters. Put every complaint in writing, date your photos, and keep copies of it all. Our mold in apartment rights guide walks through the steps and includes a letter template. For current state rules, check with the Mississippi State Department of Health or a local housing attorney.
Do Mississippi homes need a dehumidifier year-round?
Most do for a big part of the year. EPA’s target is 30 to 50 percent indoor relative humidity, and Mississippi’s outdoor air sits above that line in every month’s average. Air conditioning helps in July. It does less in April and October, when air is damp but mild and the AC barely runs. Put a hygrometer in each main room, and add dehumidification anywhere that holds above 55 percent.
How fast does mold show up after a hurricane or flood in Mississippi?
Fast. EPA guidance says mold can start growing on wet porous materials within 24 to 48 hours. After Katrina in 2005, Gulf Coast homes that stayed wet for days developed heavy growth on drywall, insulation, and floors. The working rule: dry everything within 48 hours, and treat porous materials that stayed wet longer than 72 hours as suspect. Our mold growth timeline guide shows the hour-by-hour sequence.
Source register
Every source chip on this page points here. Agency and statute pages first, then the federal technical references.
Find the mold in your Mississippi home
The scanner is open. Get a detailed photo report, next steps, testing options and estimated cleanup costs.
Scan My Photo Get the free mold checklistRelated guides on Mold Scanner AI

Mold Risk by ZIP Code
Type your ZIP, get climate based mold risk.
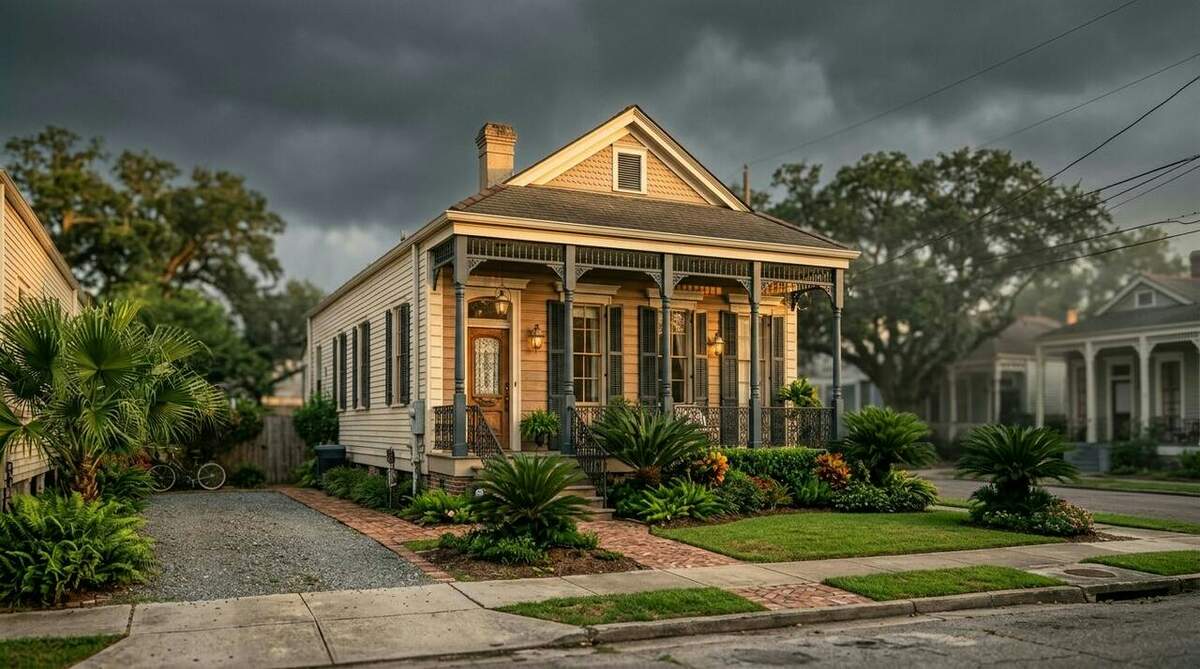
Mold in Louisiana
How the neighbor state compares, metro by metro.
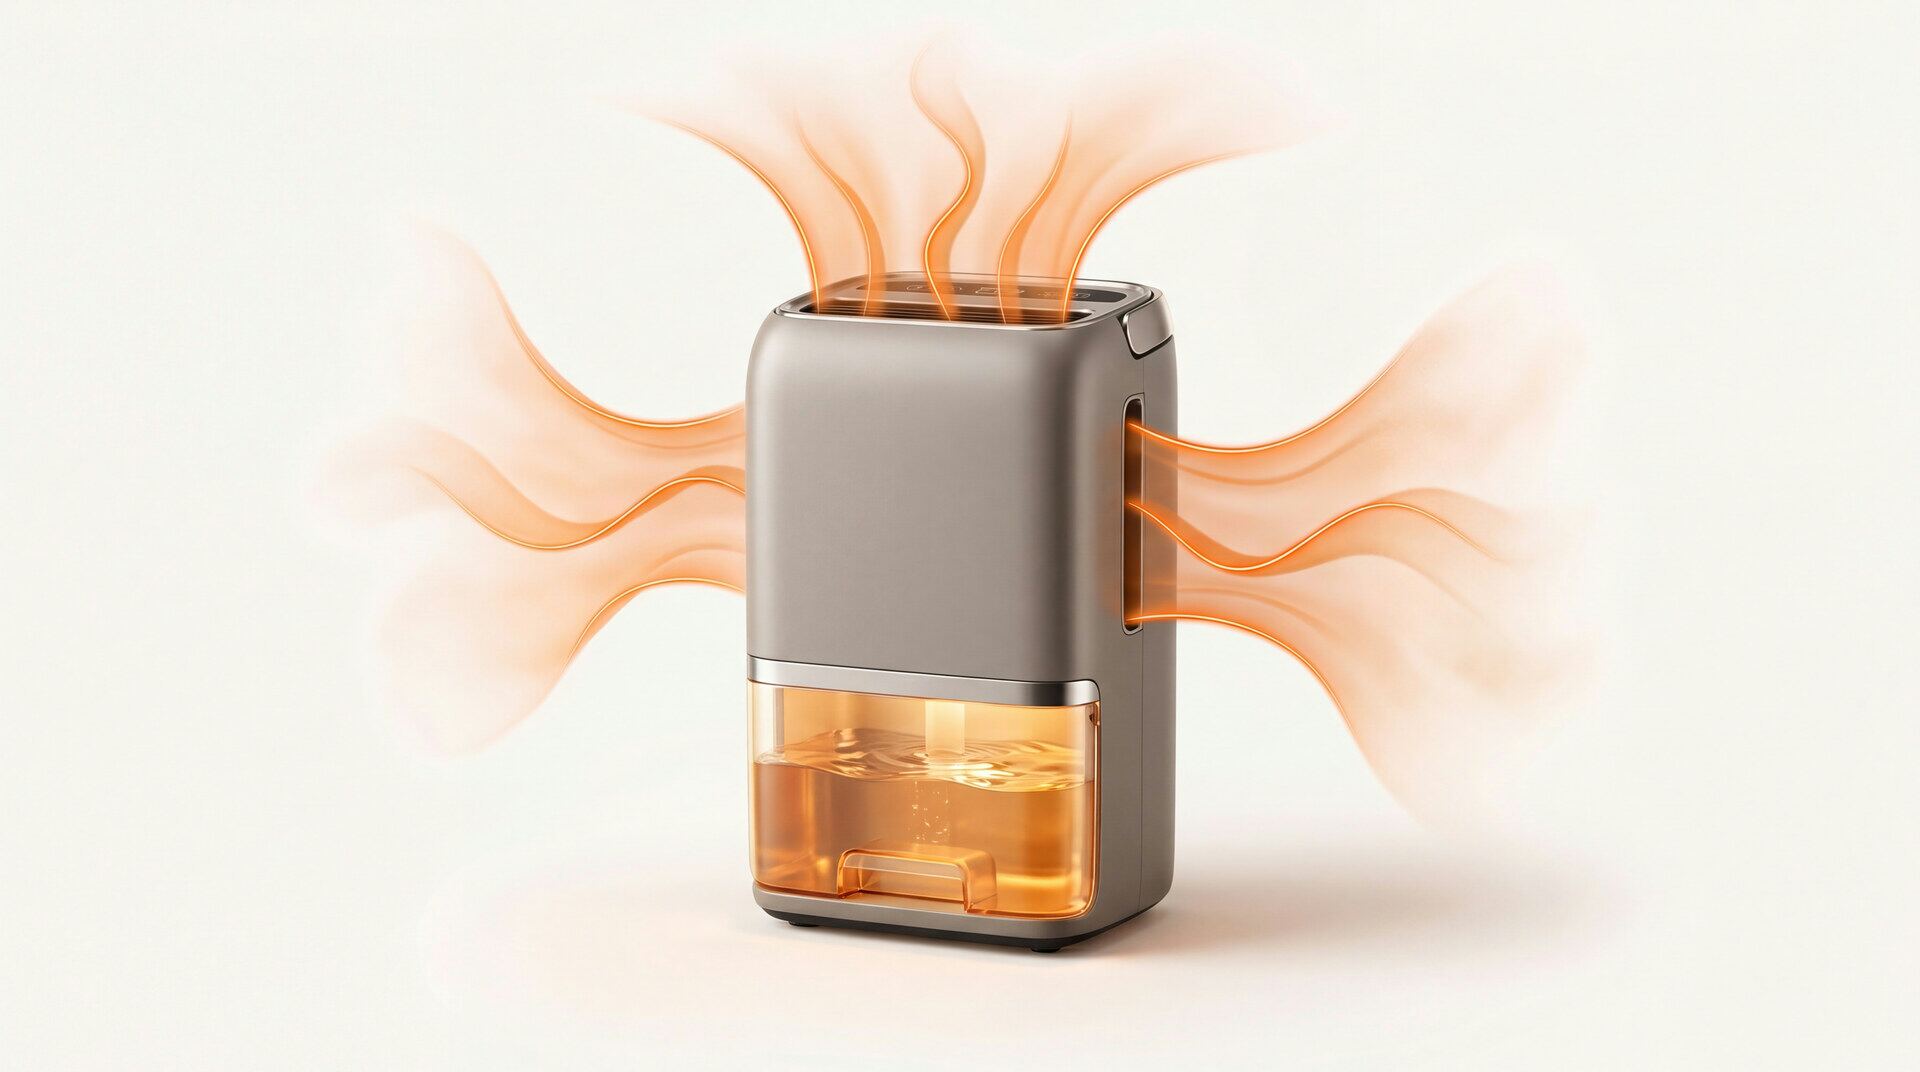
Picking the Right Dehumidifier
Sizing, drain options, and the spec that matters.
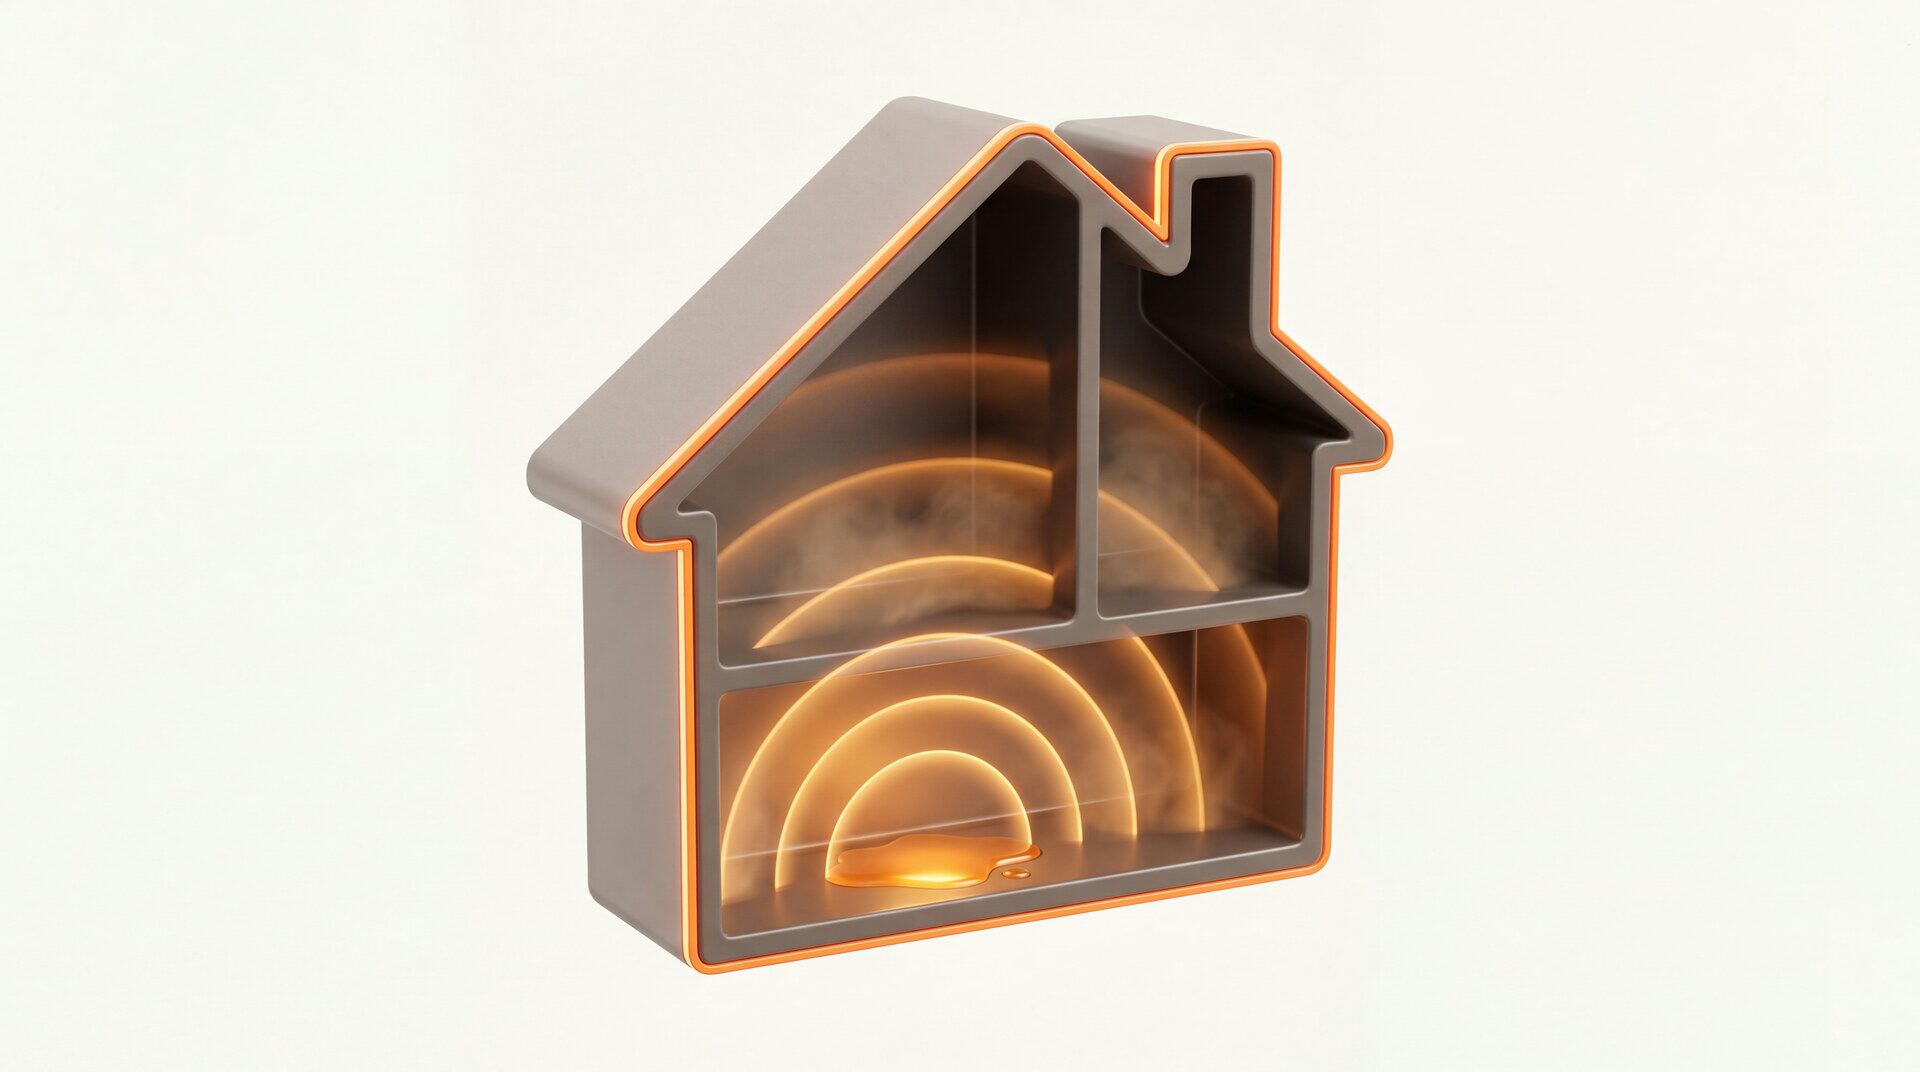
Mold Growth Timeline
Hour by hour: when spores germinate and colonies appear.
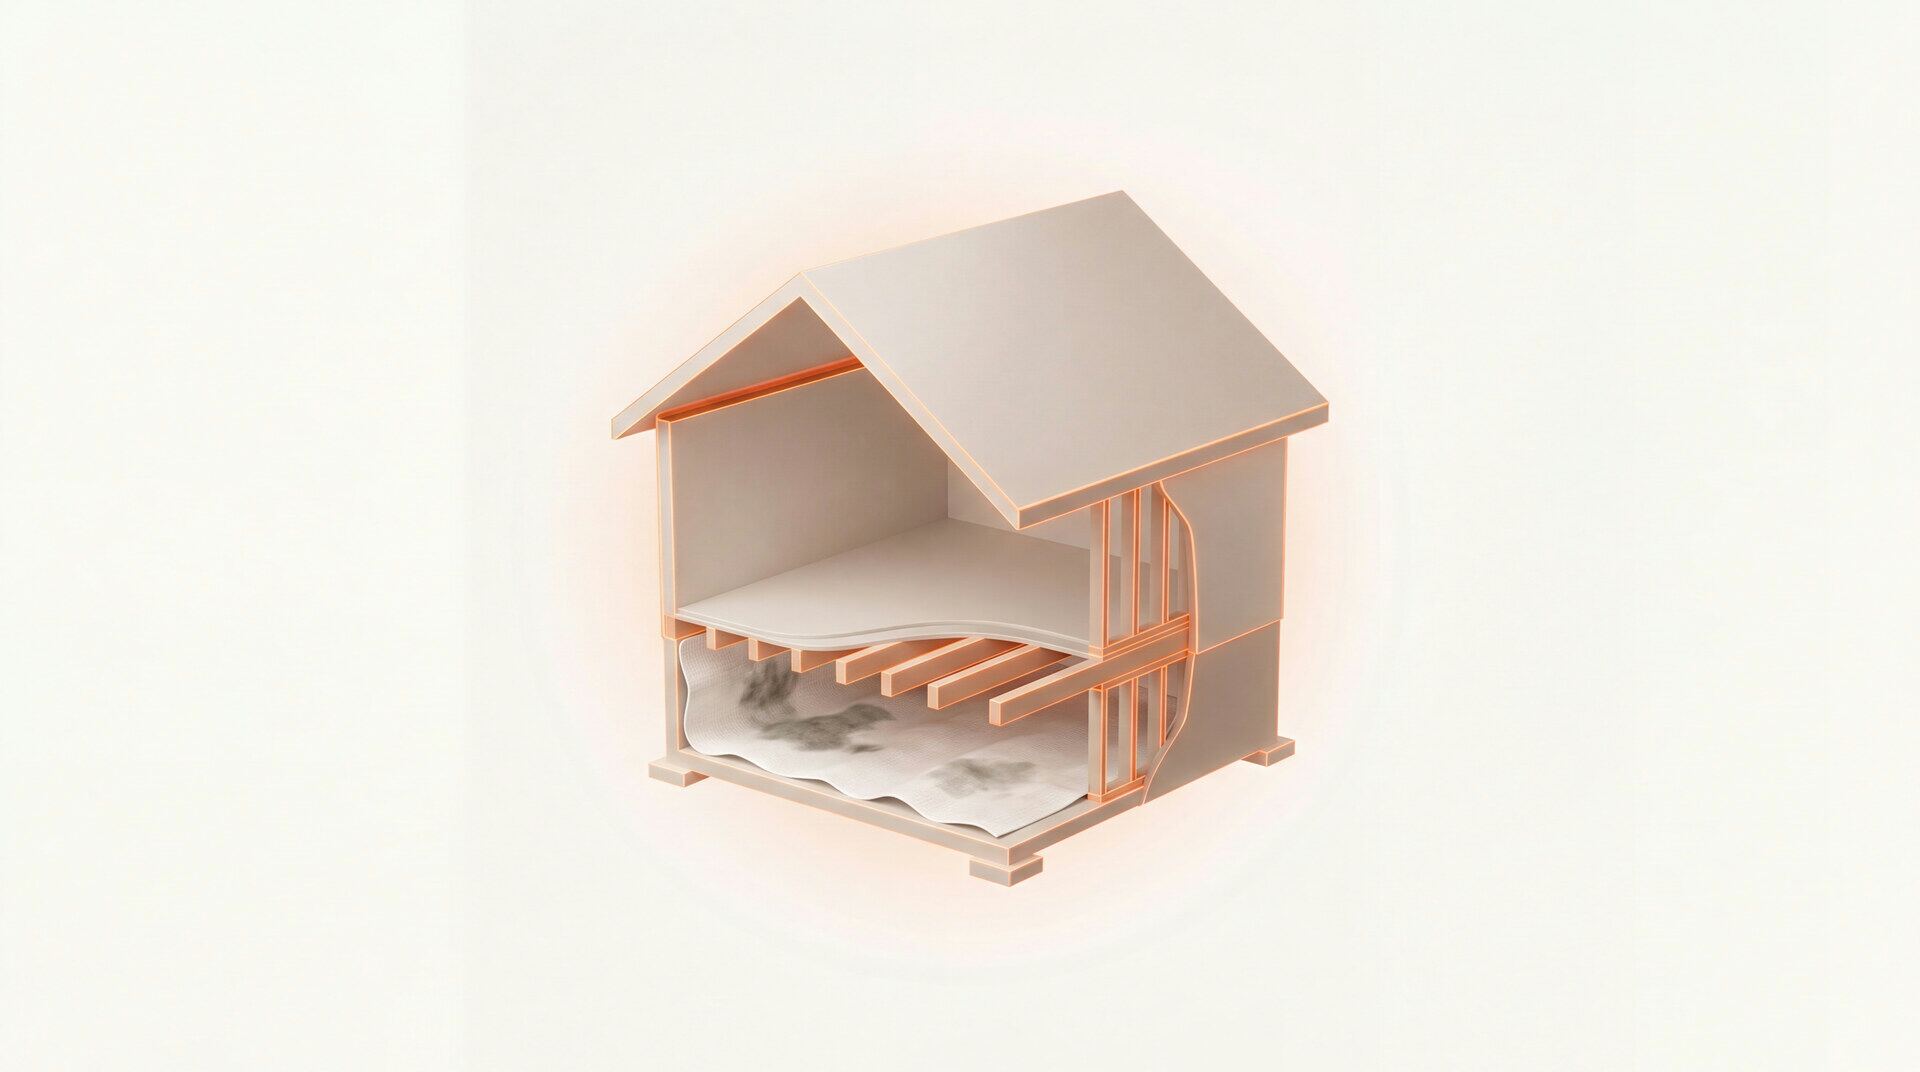
Mold in Crawl Spaces
Vapor barriers, vents, and what to look for under the house.

Renters: Mold and Your Rights
Letters, documentation, and next steps that work.